Understand your Mac.
Every layer of your Mac — monitored, explained, and safe to act on.
Das Problem
Most Mac utilities do two things: Delete files hoping it helps Or show raw numbers you can’t interpret Neither tells you what’s actually happening.
Klingt bekannt?
78% memory in alarming red — but macOS is caching efficiently. 14 apps with microphone access you never audited. A cleanup tool that bypassed Trash and broke your workflow.
Ein anderer Ansatz
Aurora Control doesn't clean your Mac. It helps you understand it. A team of specialists examines your system from every angle — and an intelligence layer explains what it finds, why it matters, and exactly what to do about it. You stay in control; nothing happens without you.
Specialists for every layer. One intelligence layer over all of them.
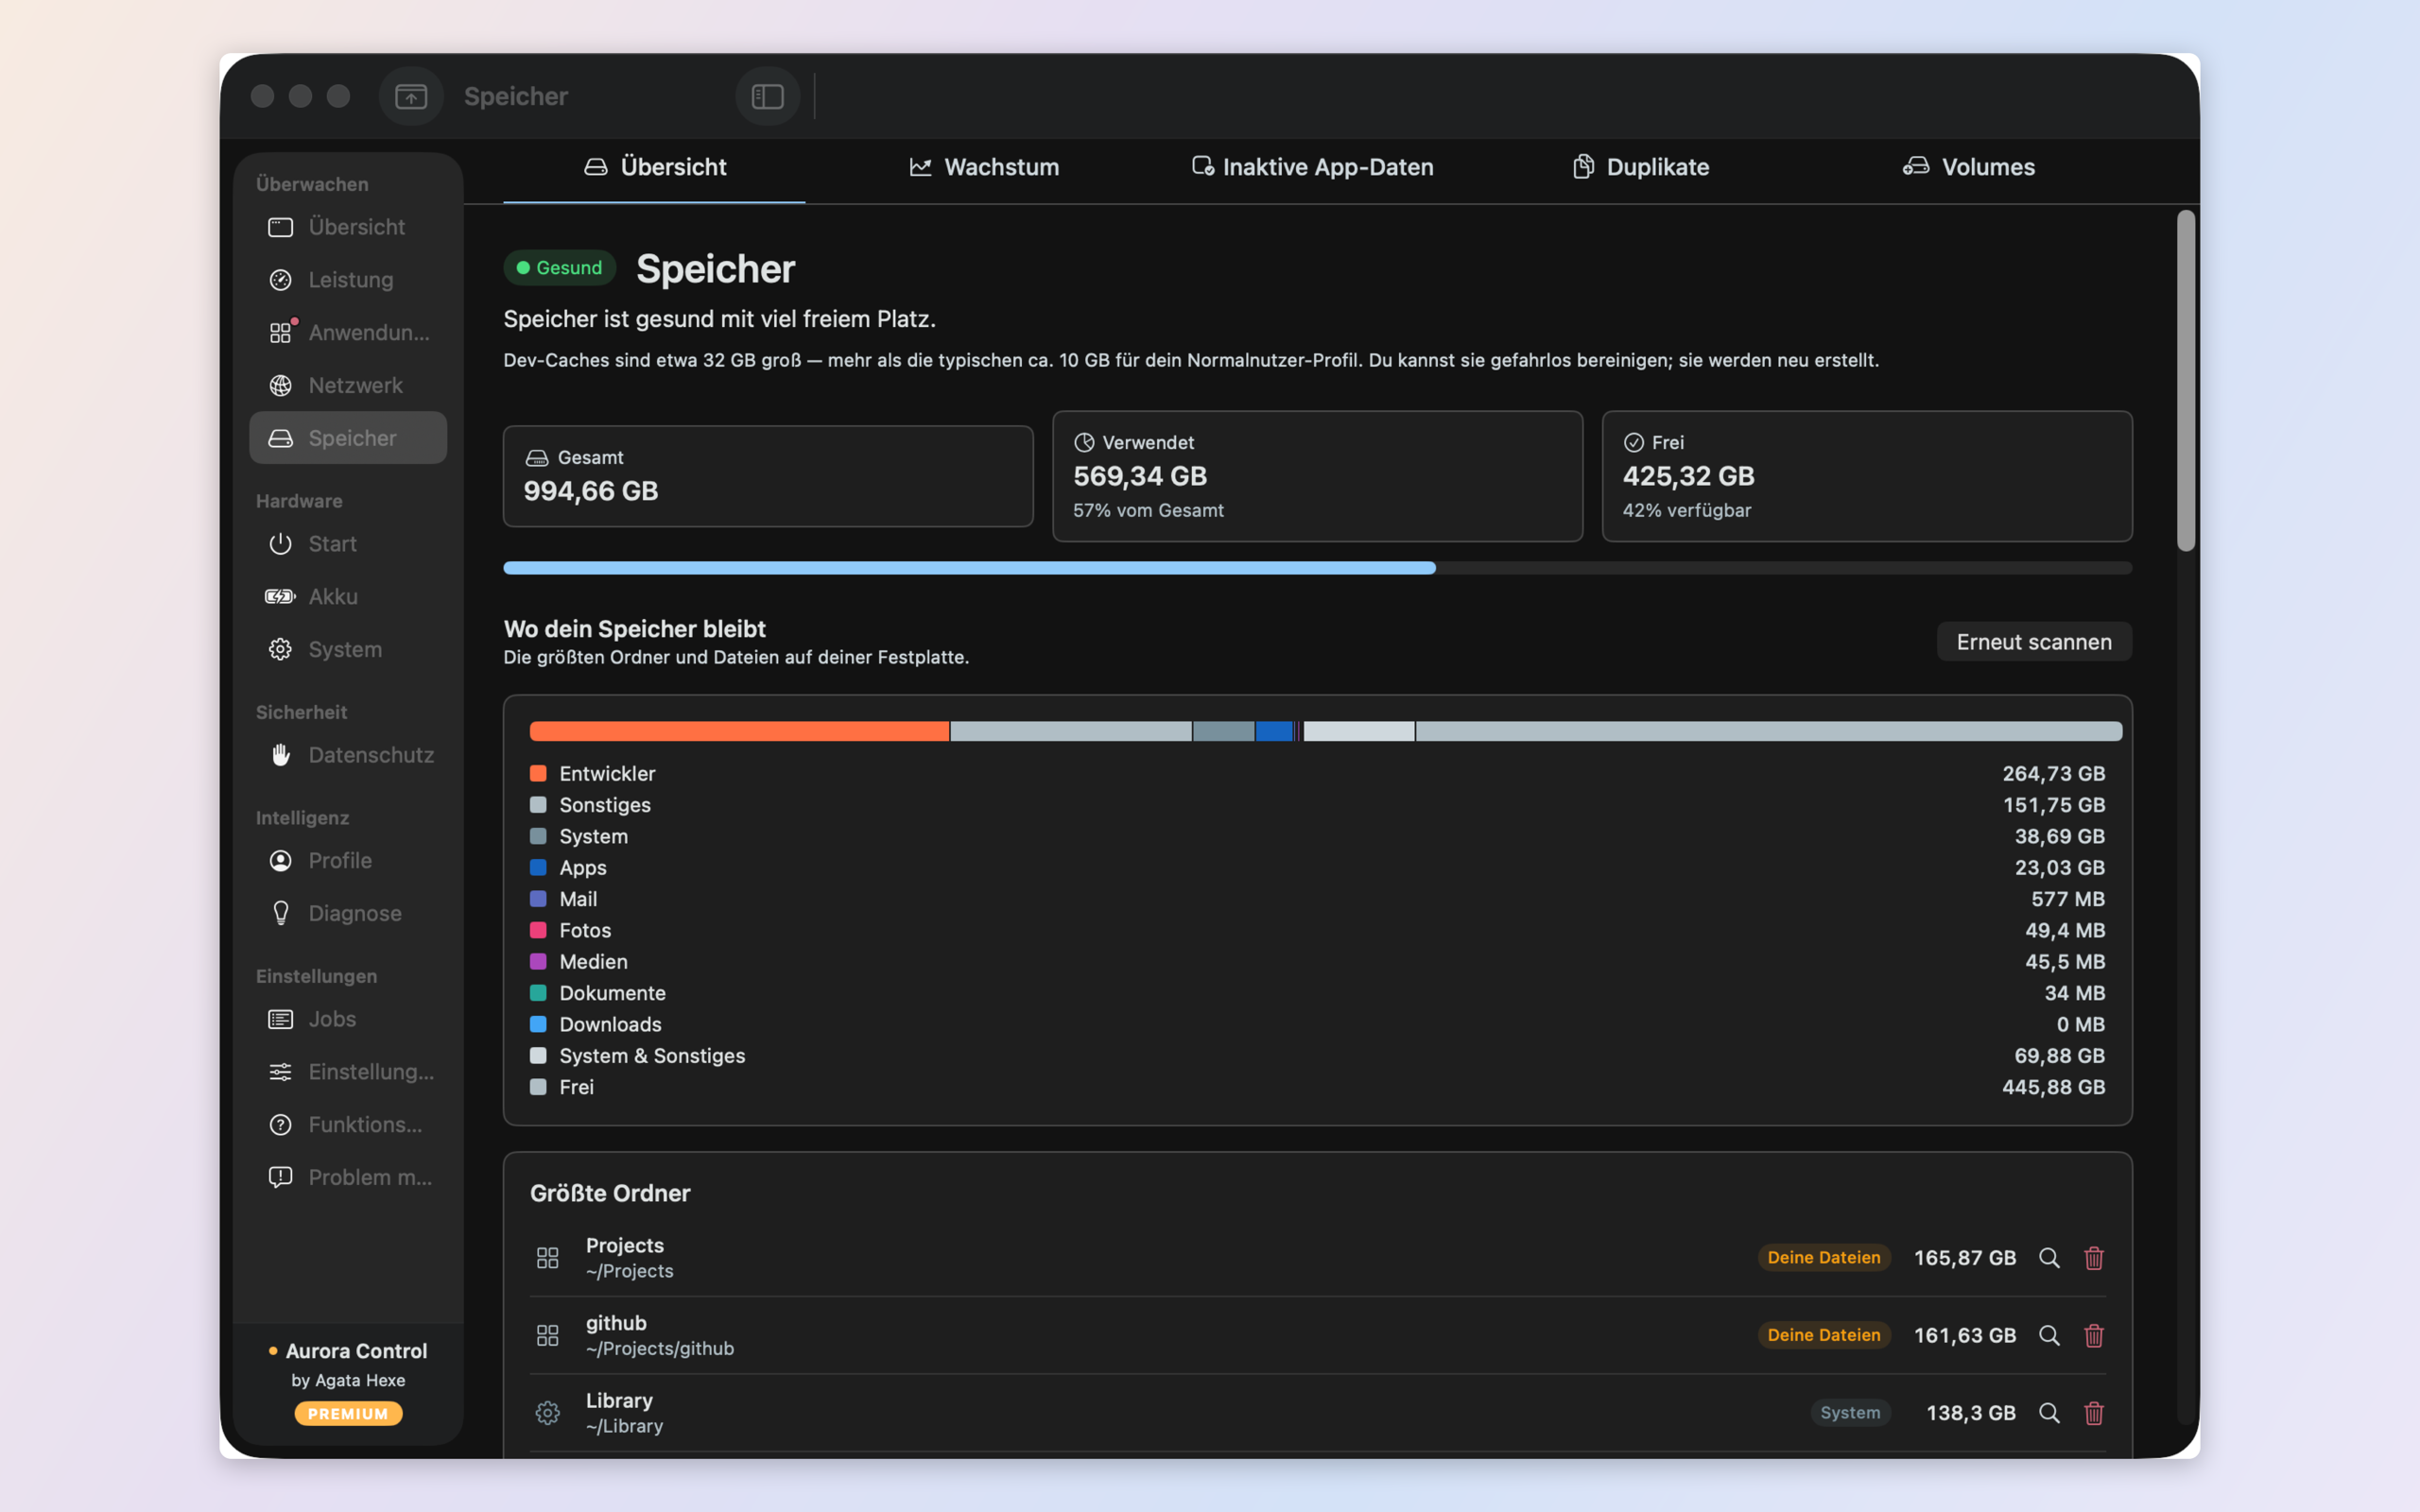
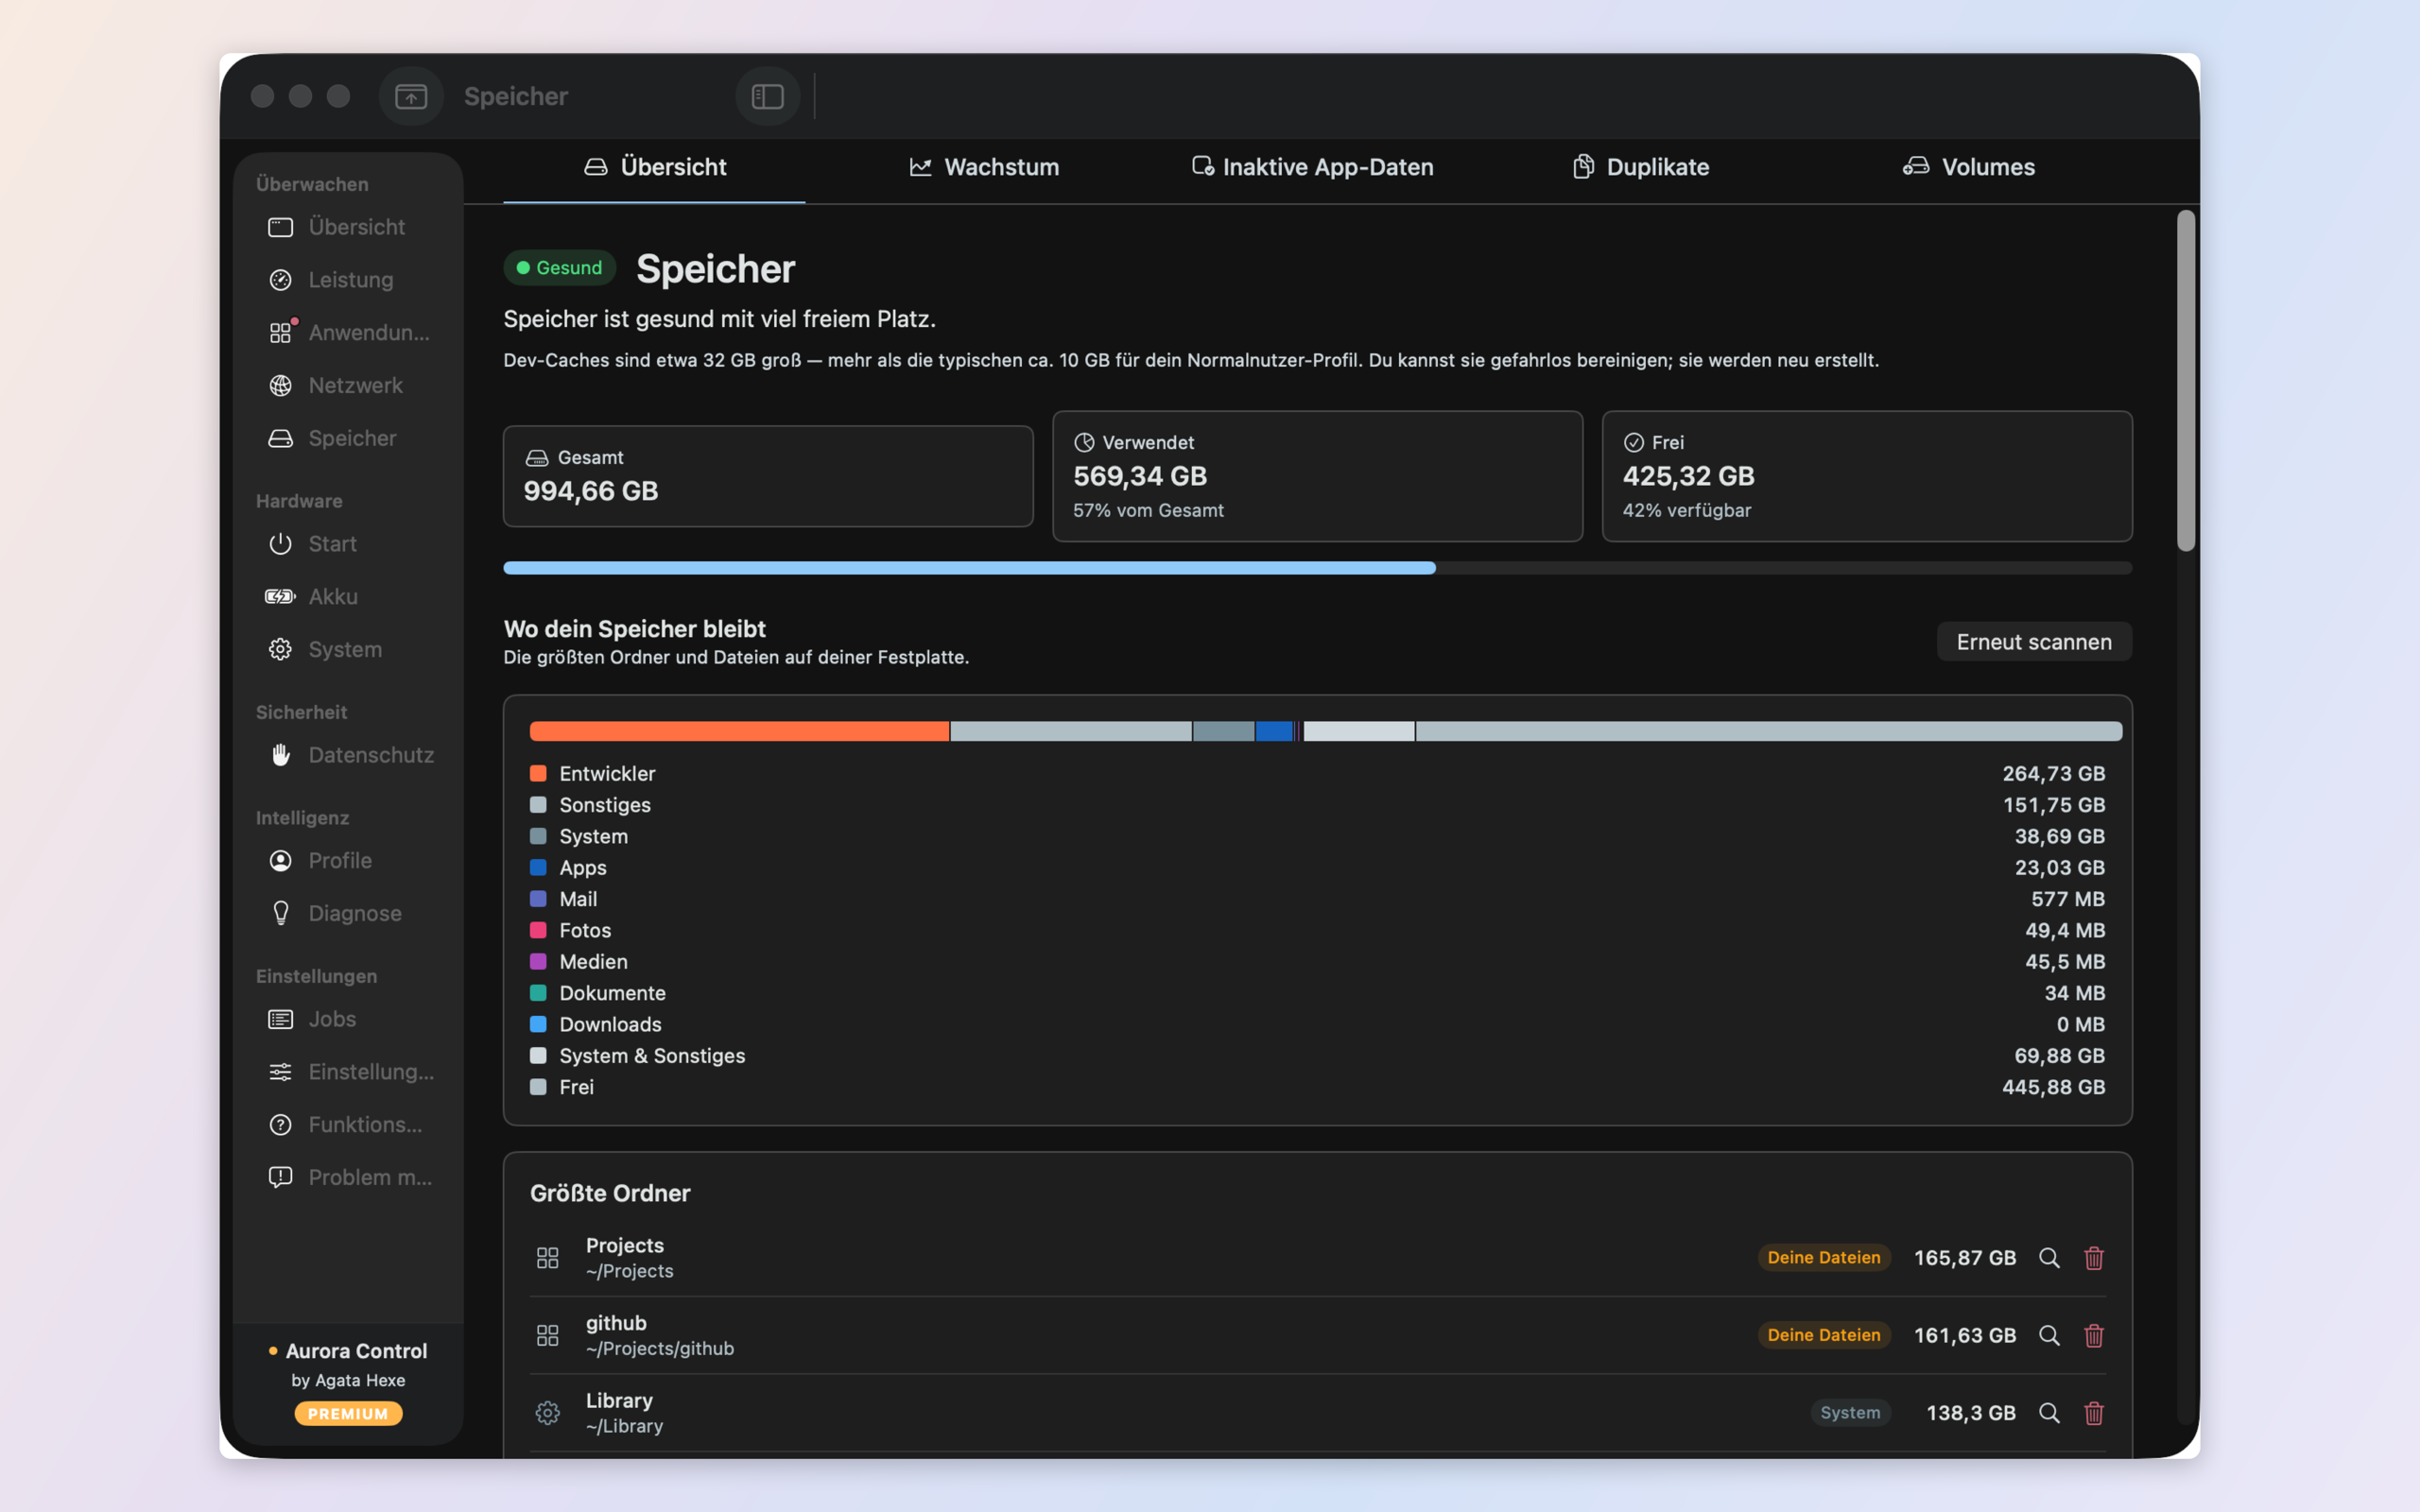
Storage
Reclaim the space you forgot about
Free space, a growth timeline mapped to the tools that fill it (Xcode, npm, Docker…), leftovers from uninstalled apps, and a SHA-256 duplicate finder. A safe-clean simulation shows the impact before you touch anything.
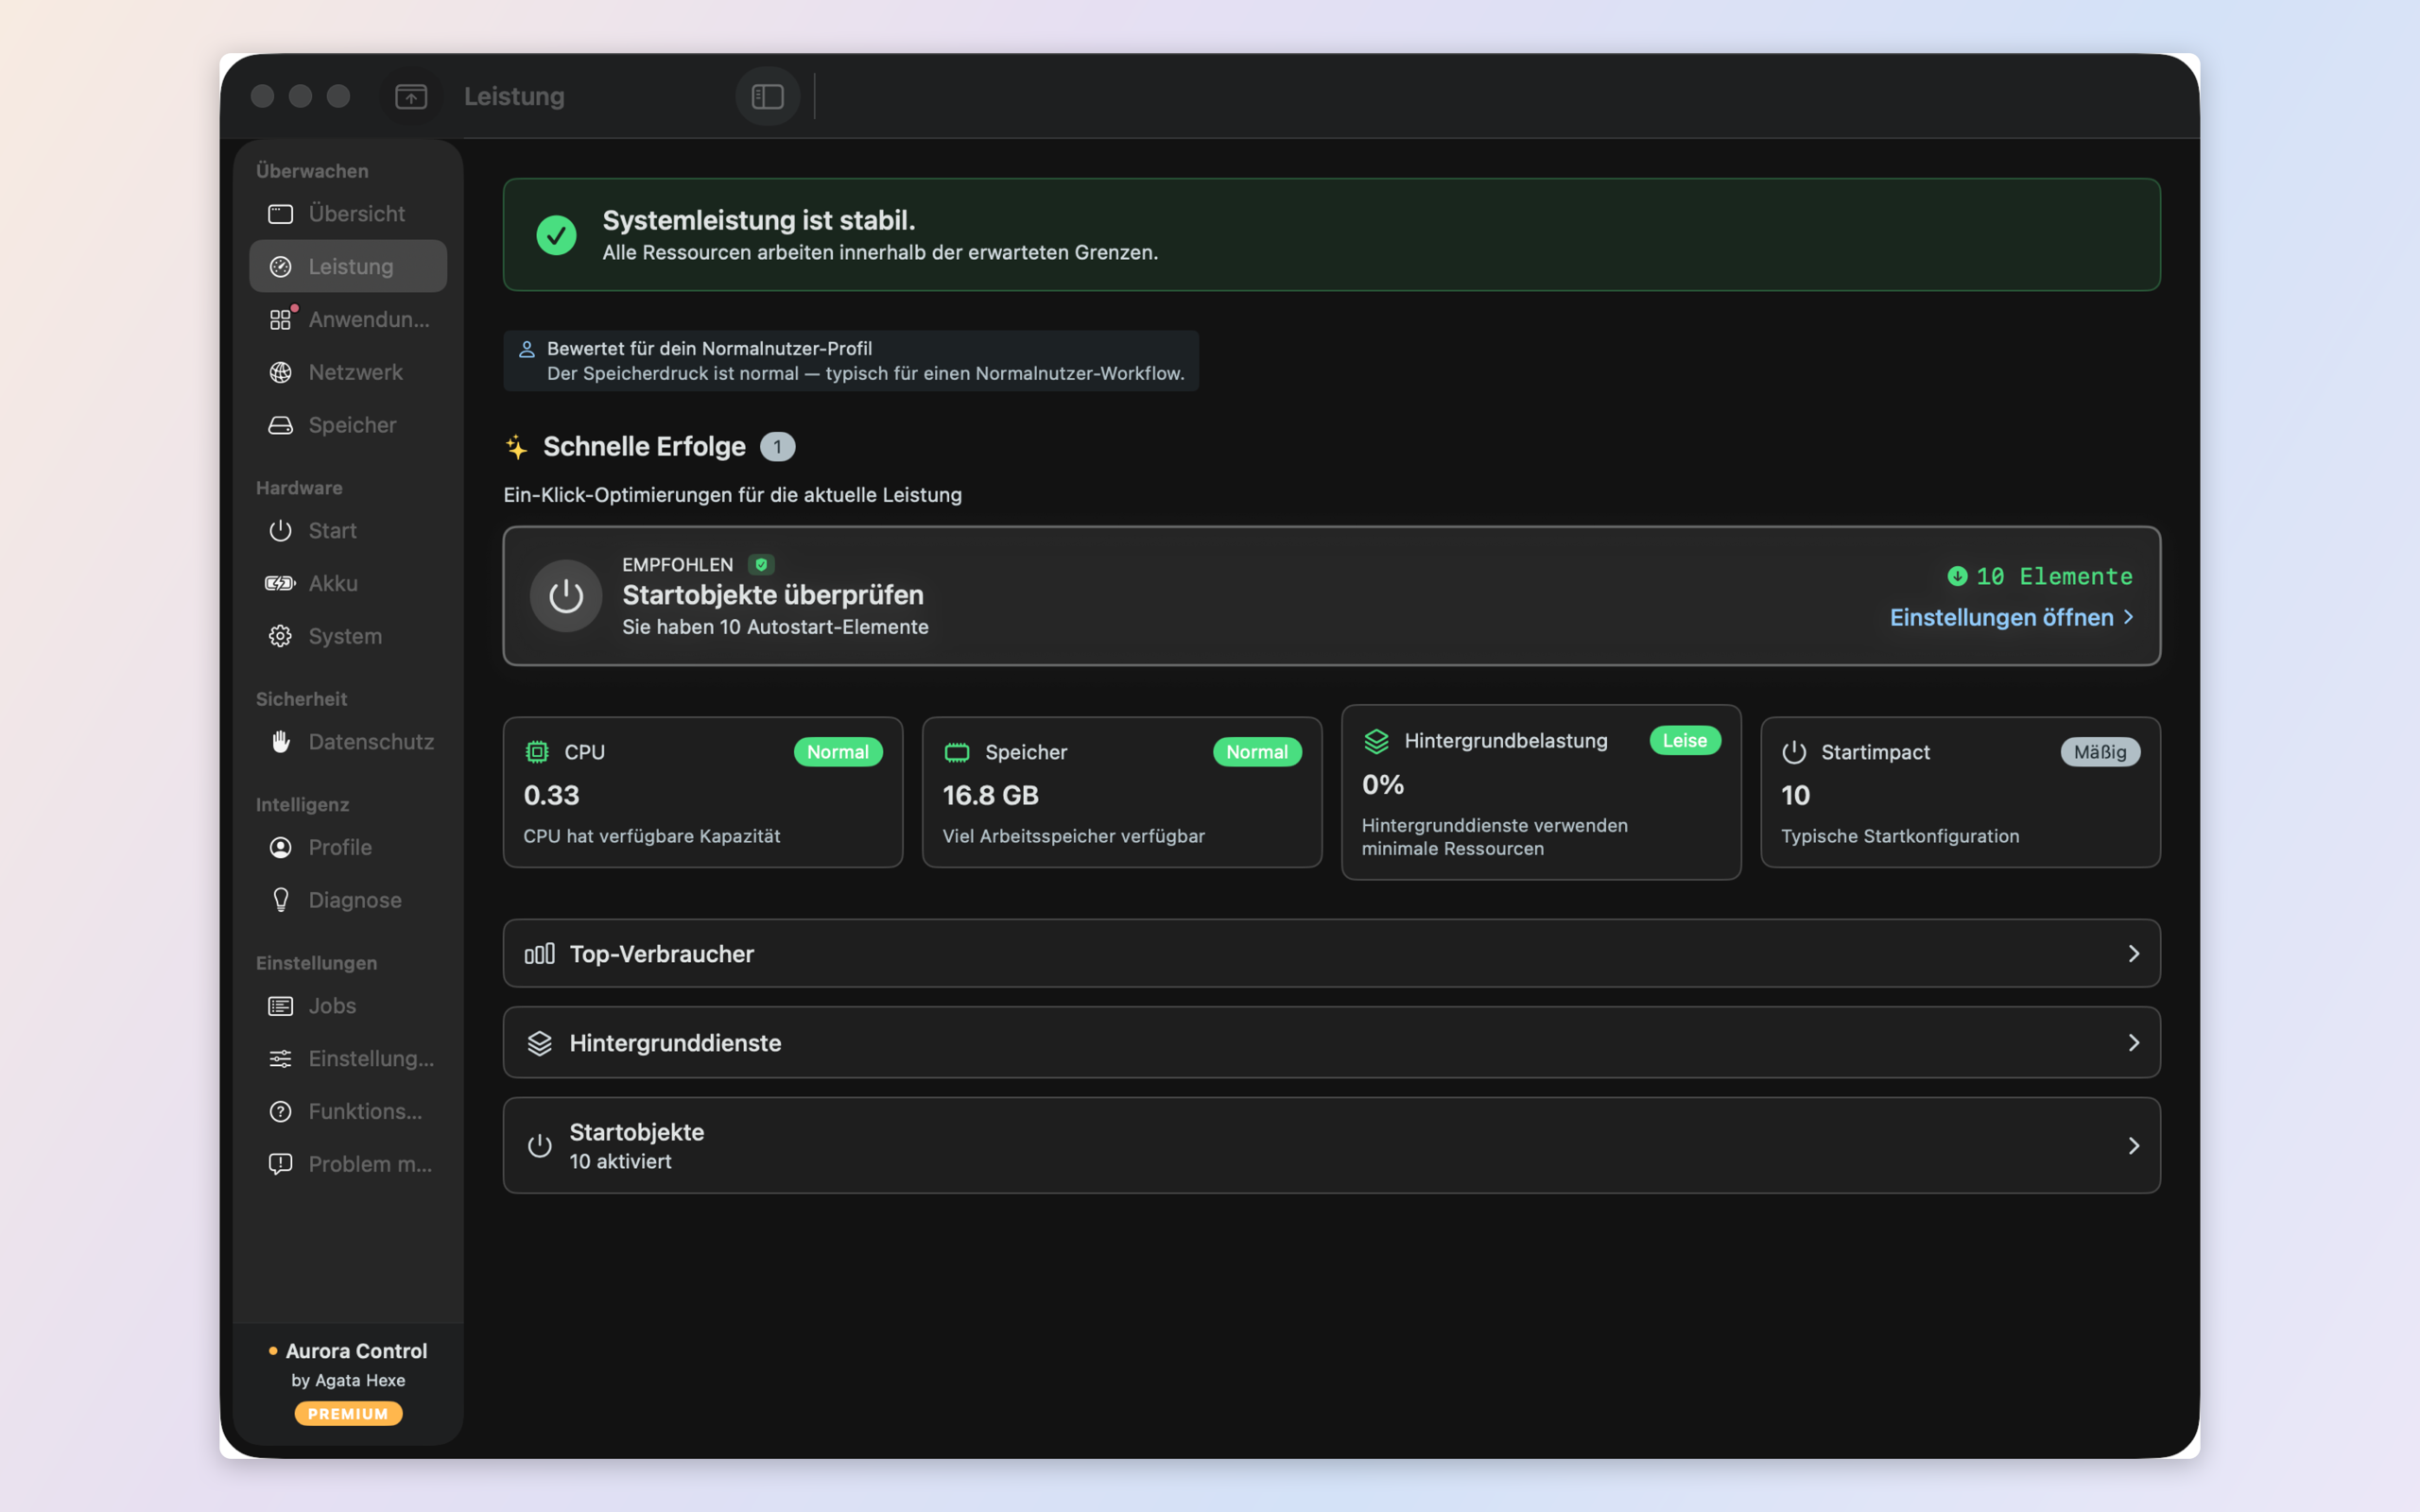
Performance & Memory
Beyond the 78% red
Memory pressure, not just usage, plus load per core and the processes behind it — interpreted through your profile, never as raw numbers.
Applications
Find the app slowing you down
Every running app with its memory and CPU footprint and child processes. Find the silent resource hog in seconds.
How it works
Step 1
Every module analyzes
Open the app — every module starts within 15 seconds. No account. No setup.
Step 2
Your workflow shapes the diagnosis
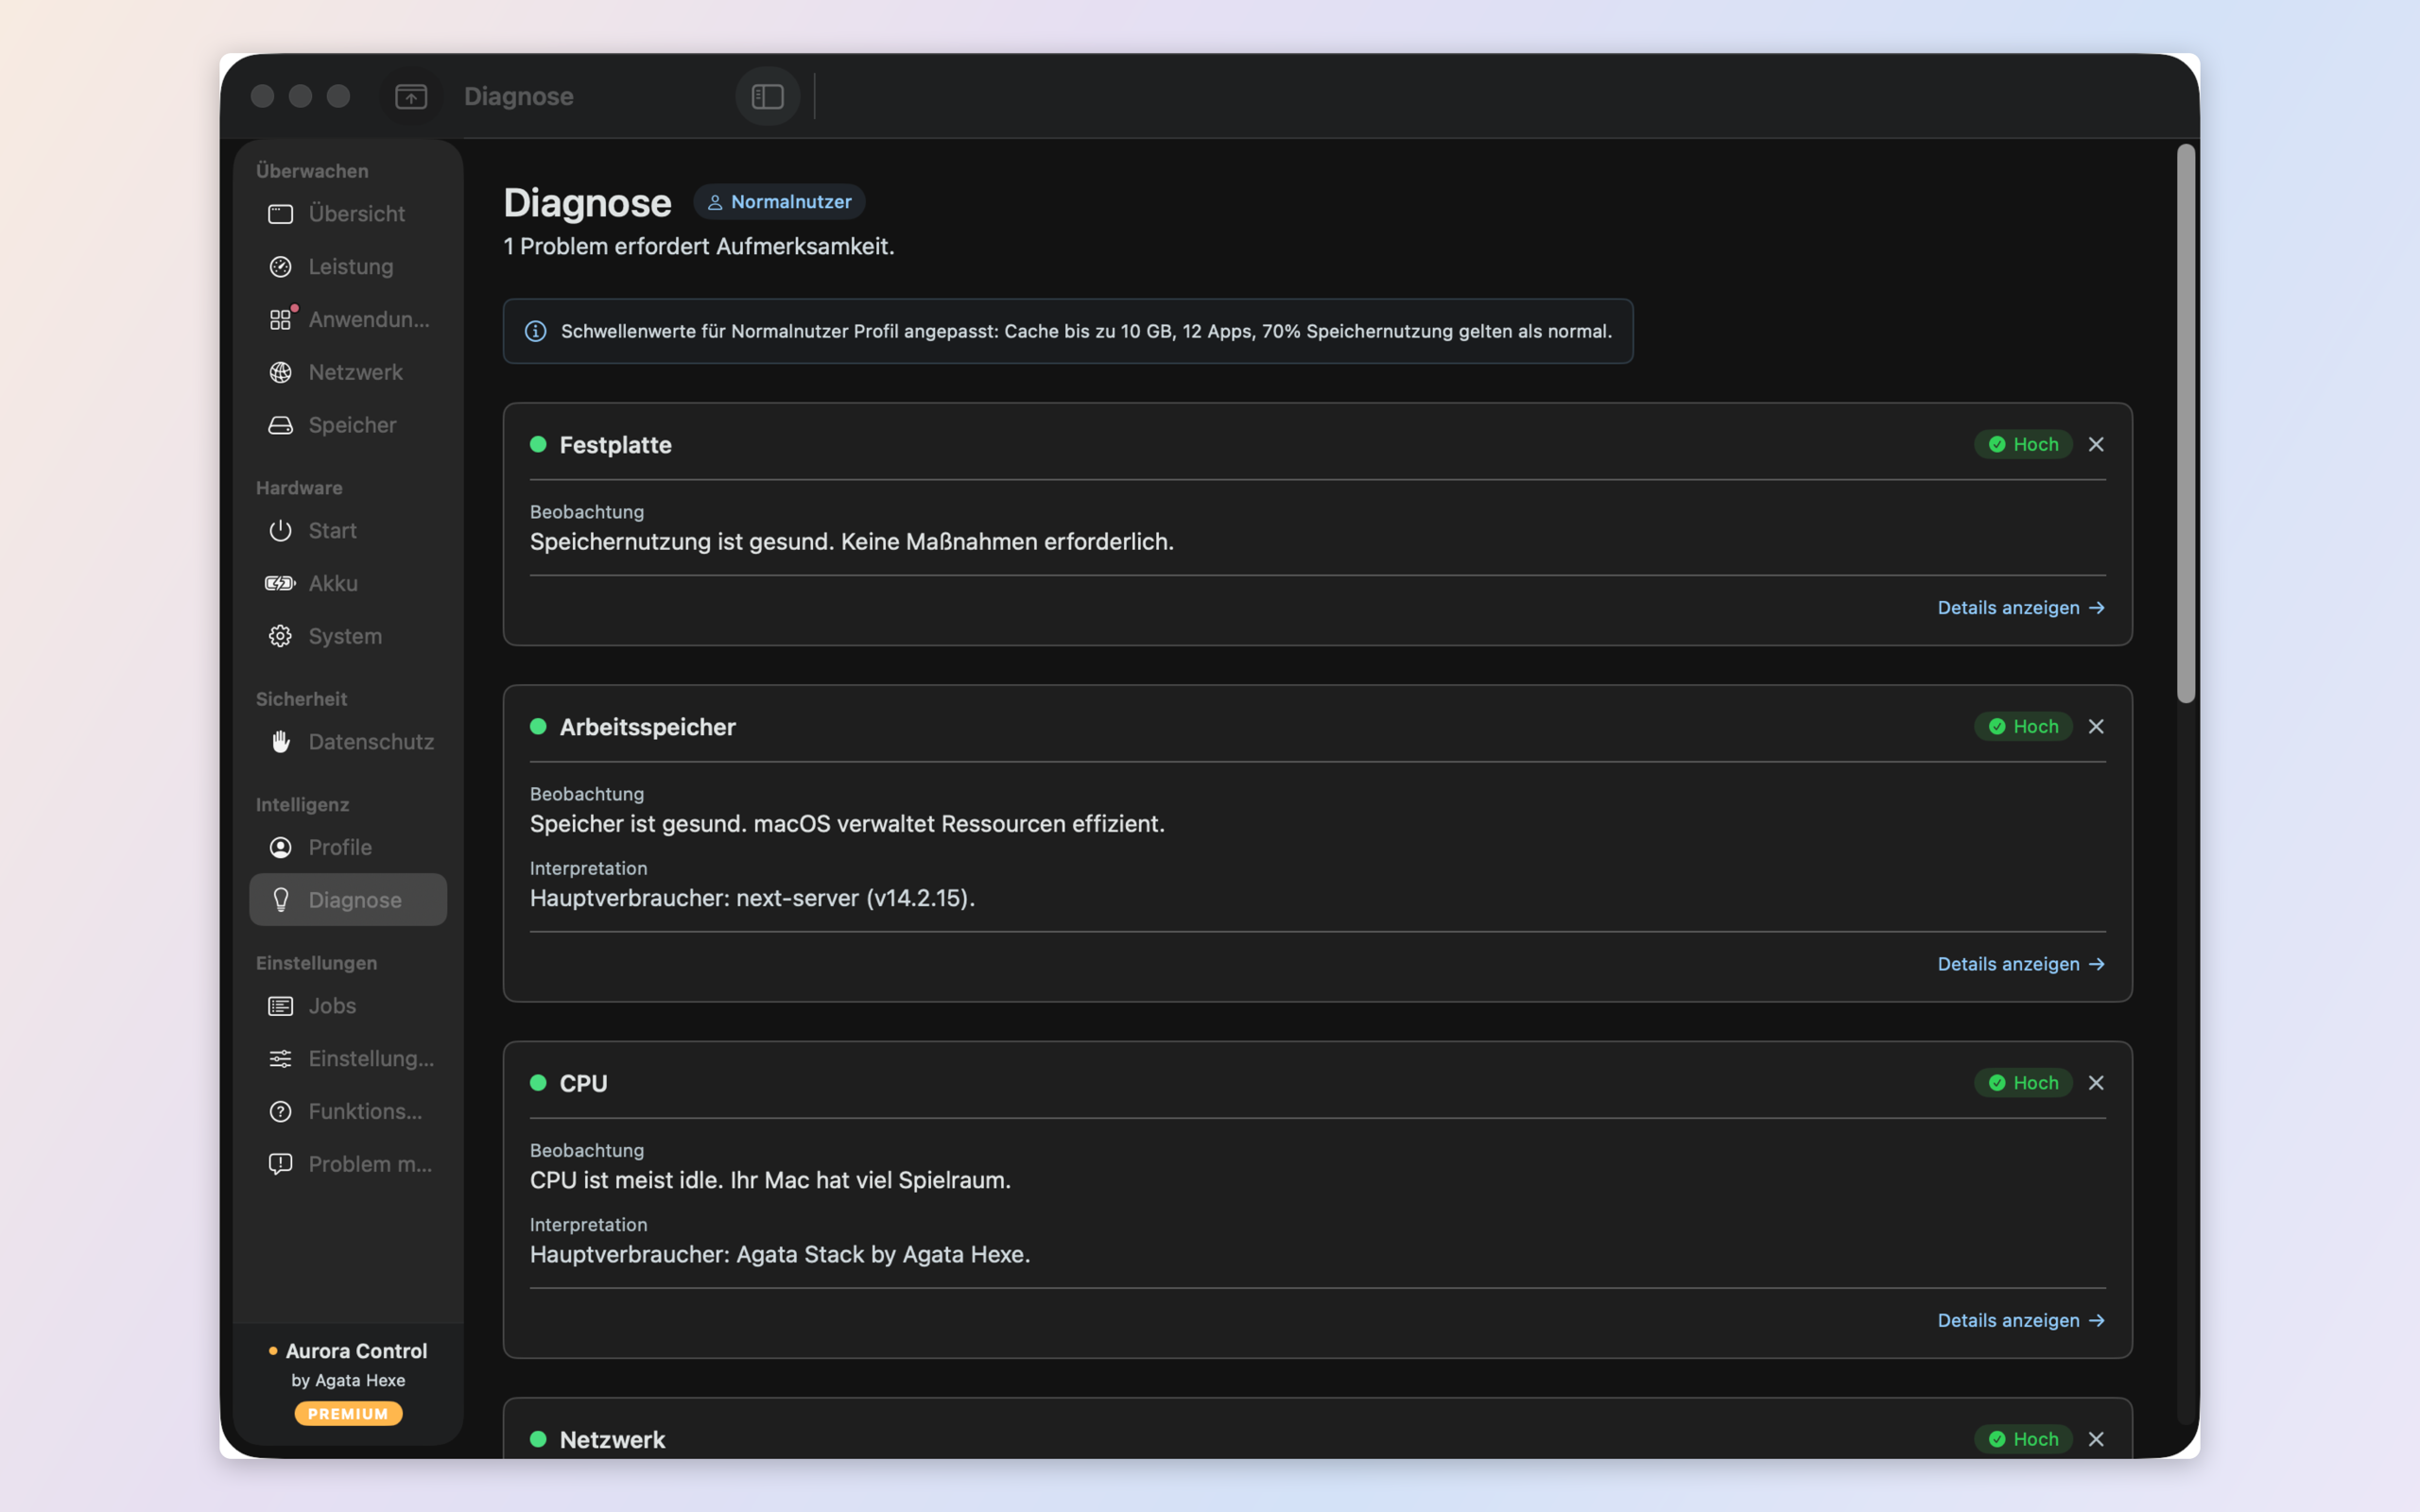
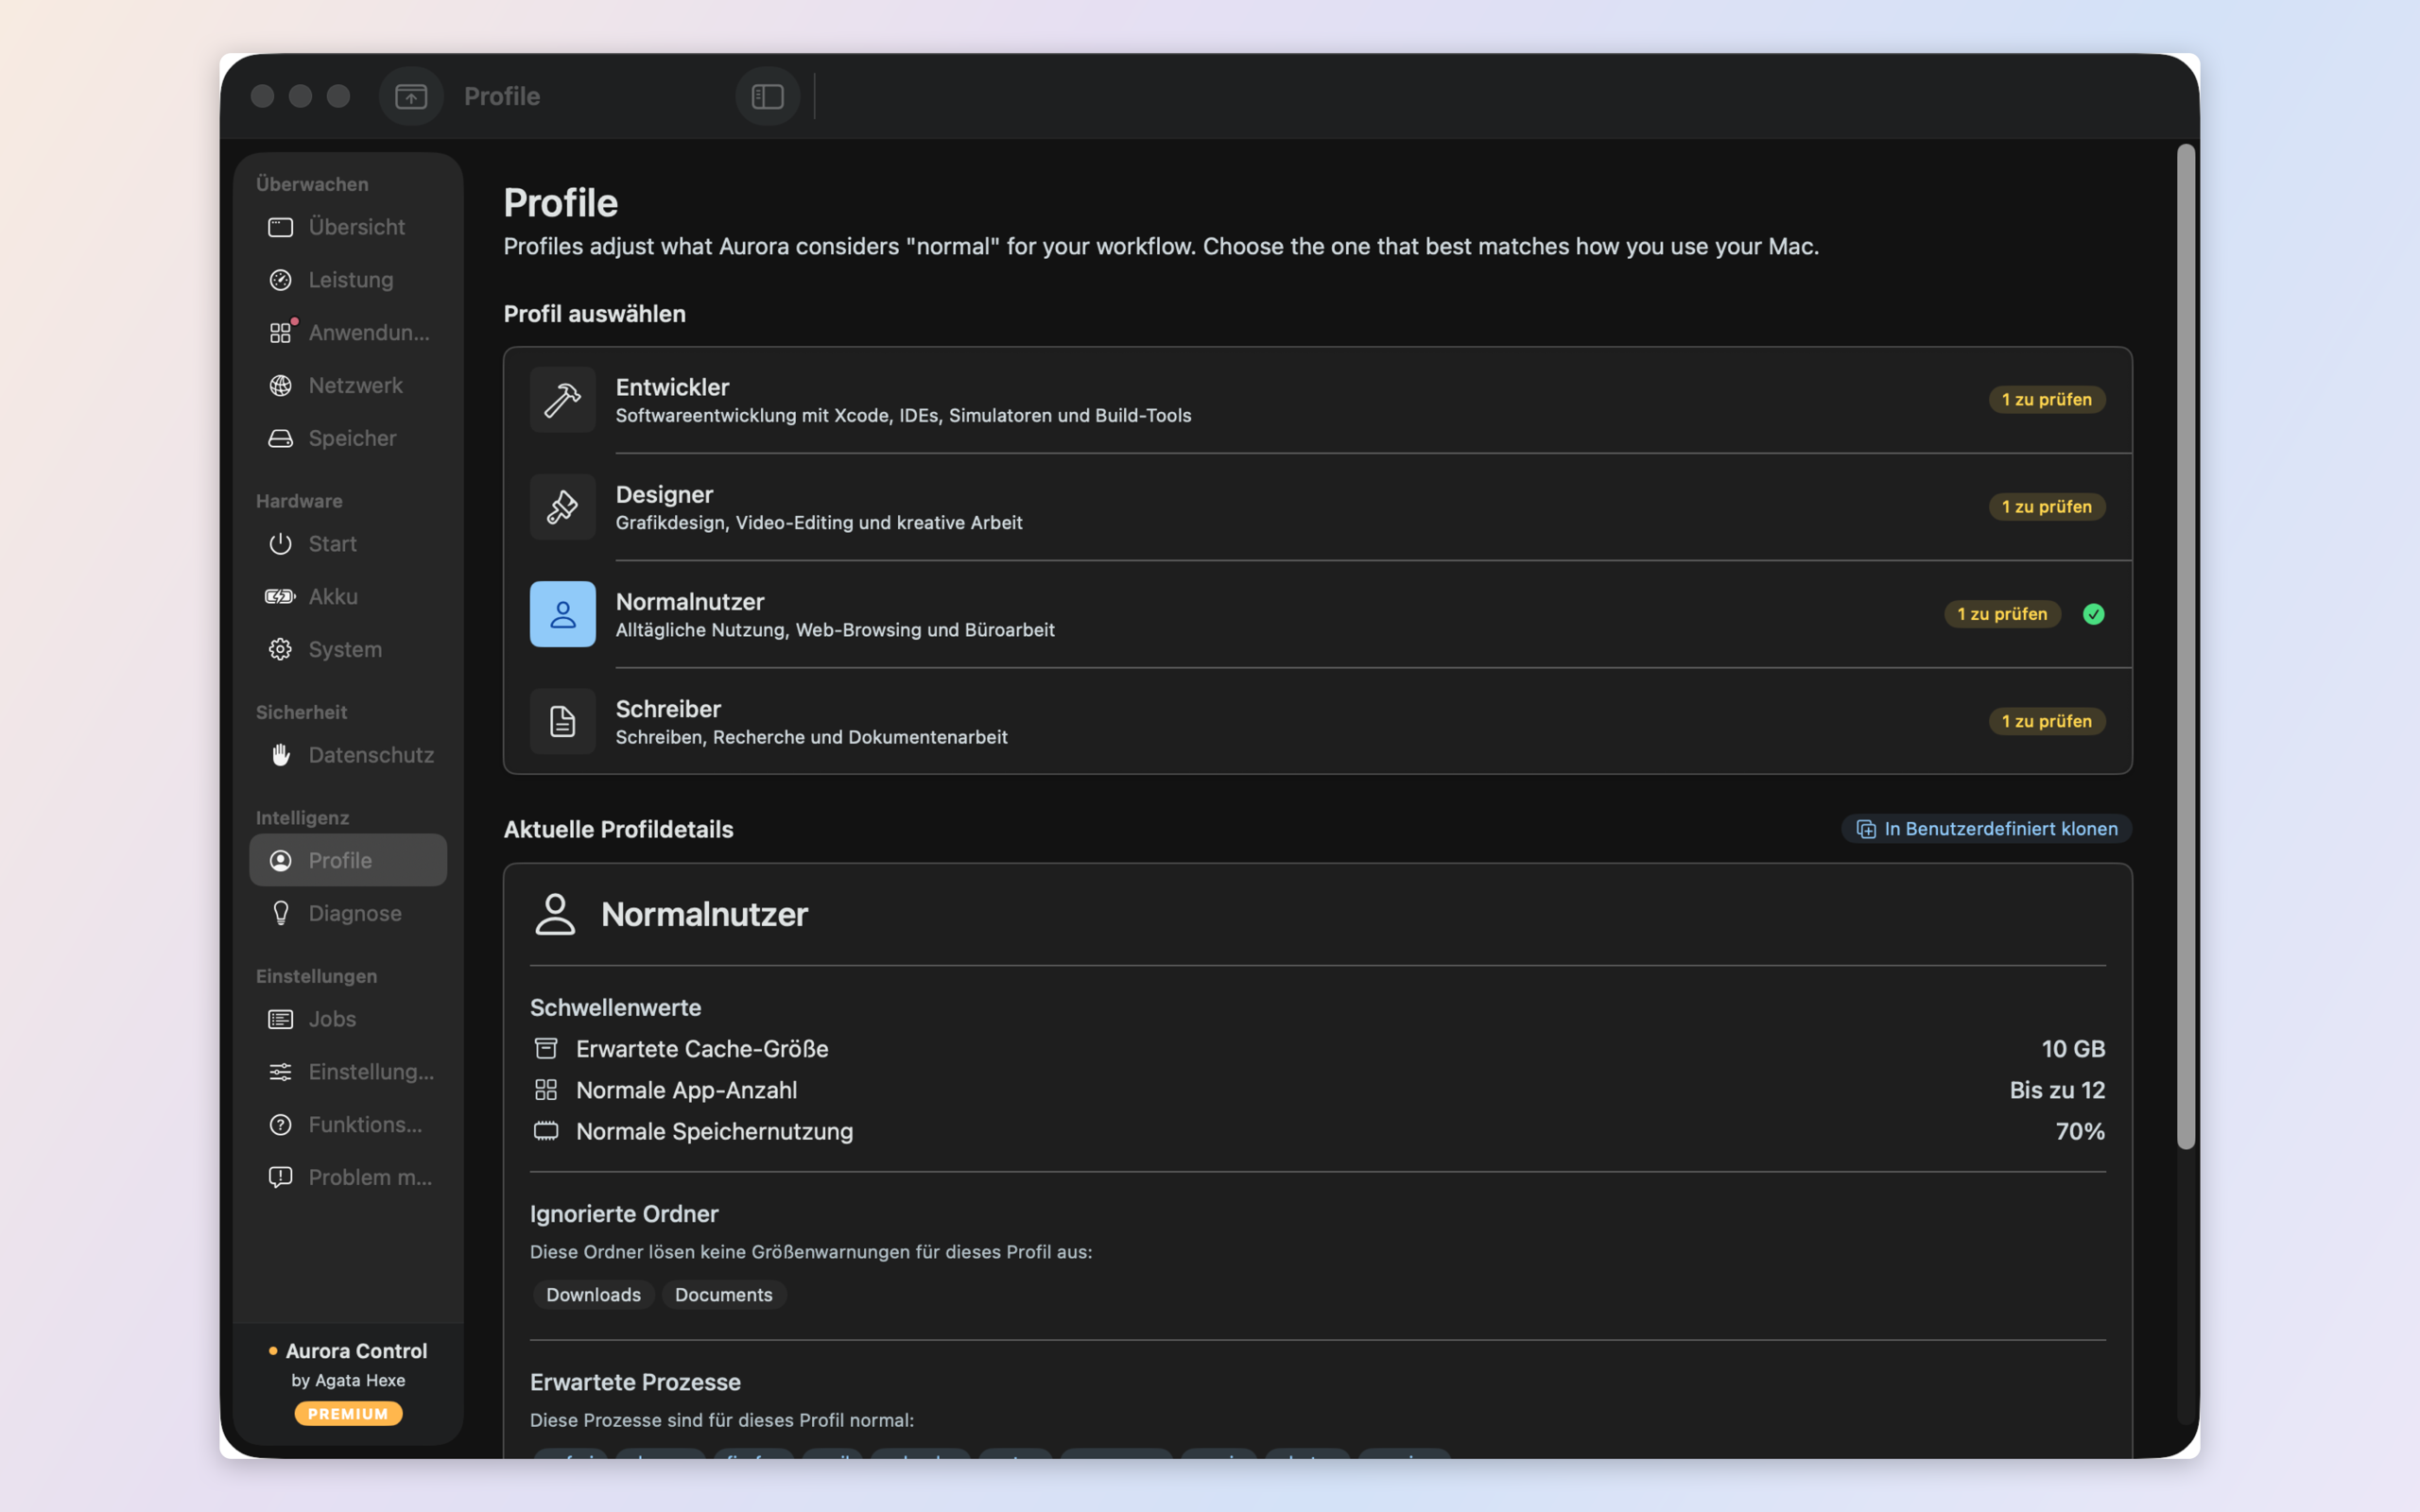
Pick a profile — Developer, Designer, Writer, General, or your own custom one. Aurora can even detect your tools and suggest the right one. Every threshold adapts.
Step 3
Act with full understanding
Every recommendation: What happened → Why → What to do. Three safety tiers. Every action reversible.
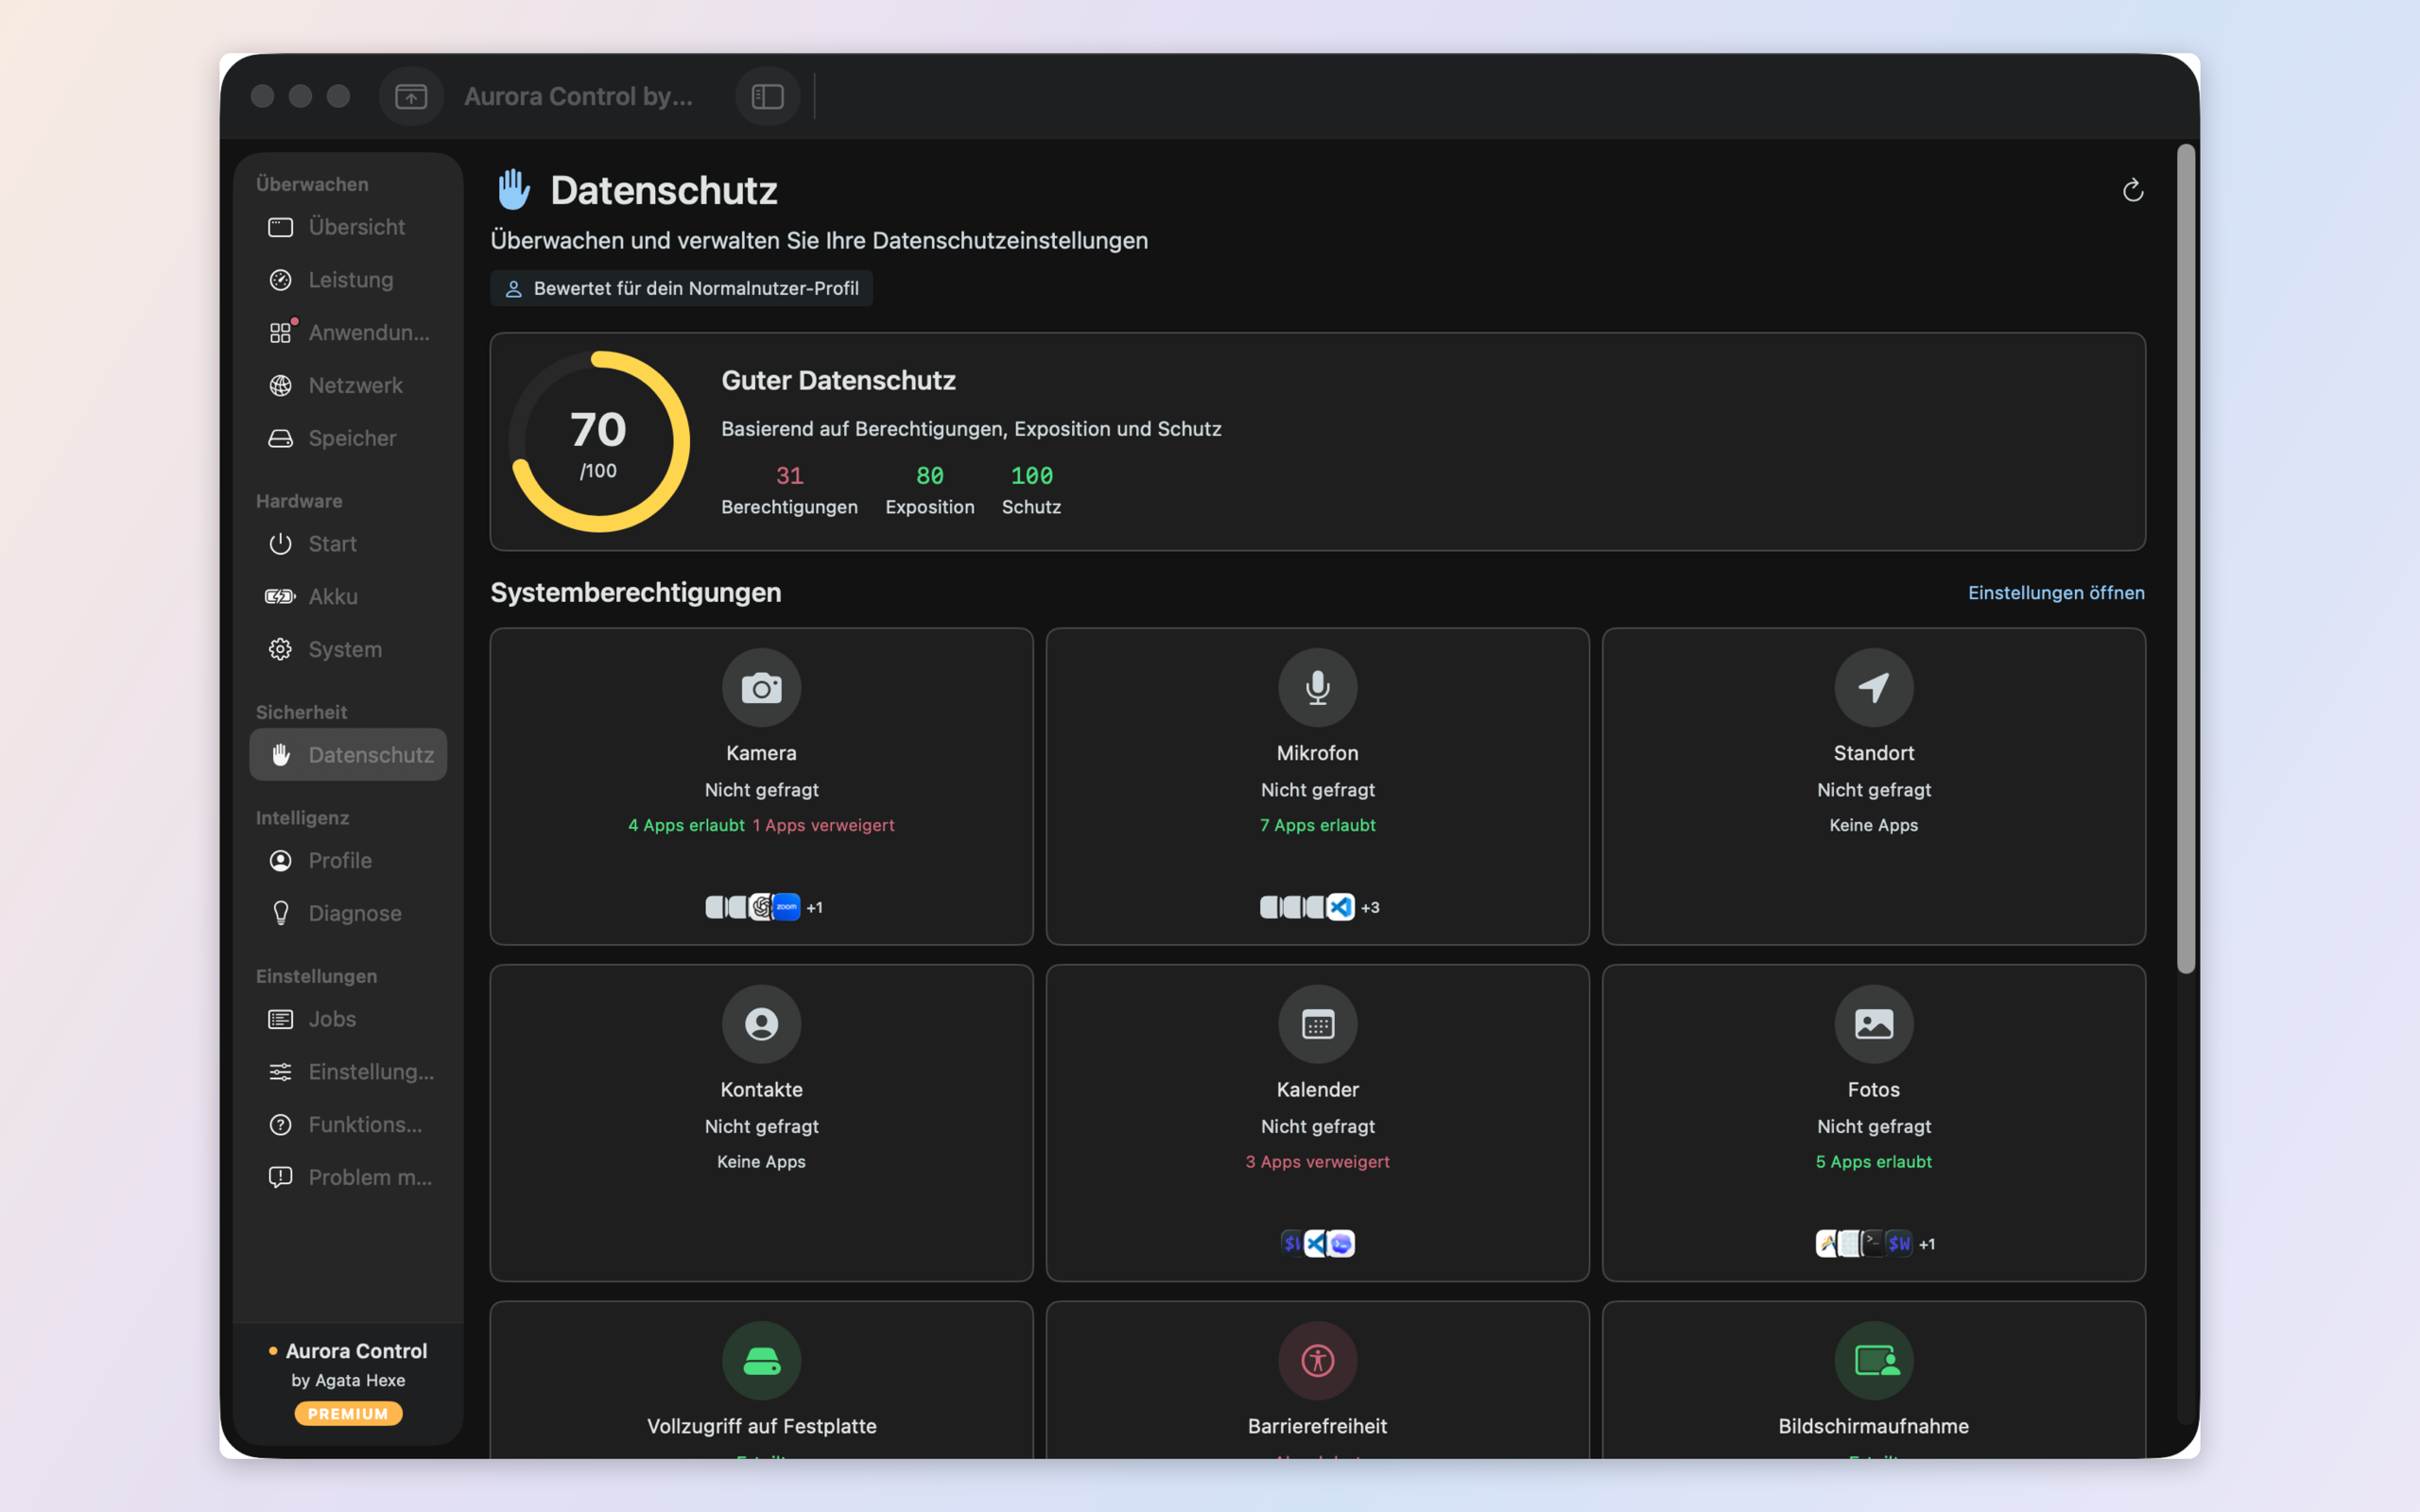
See it in action
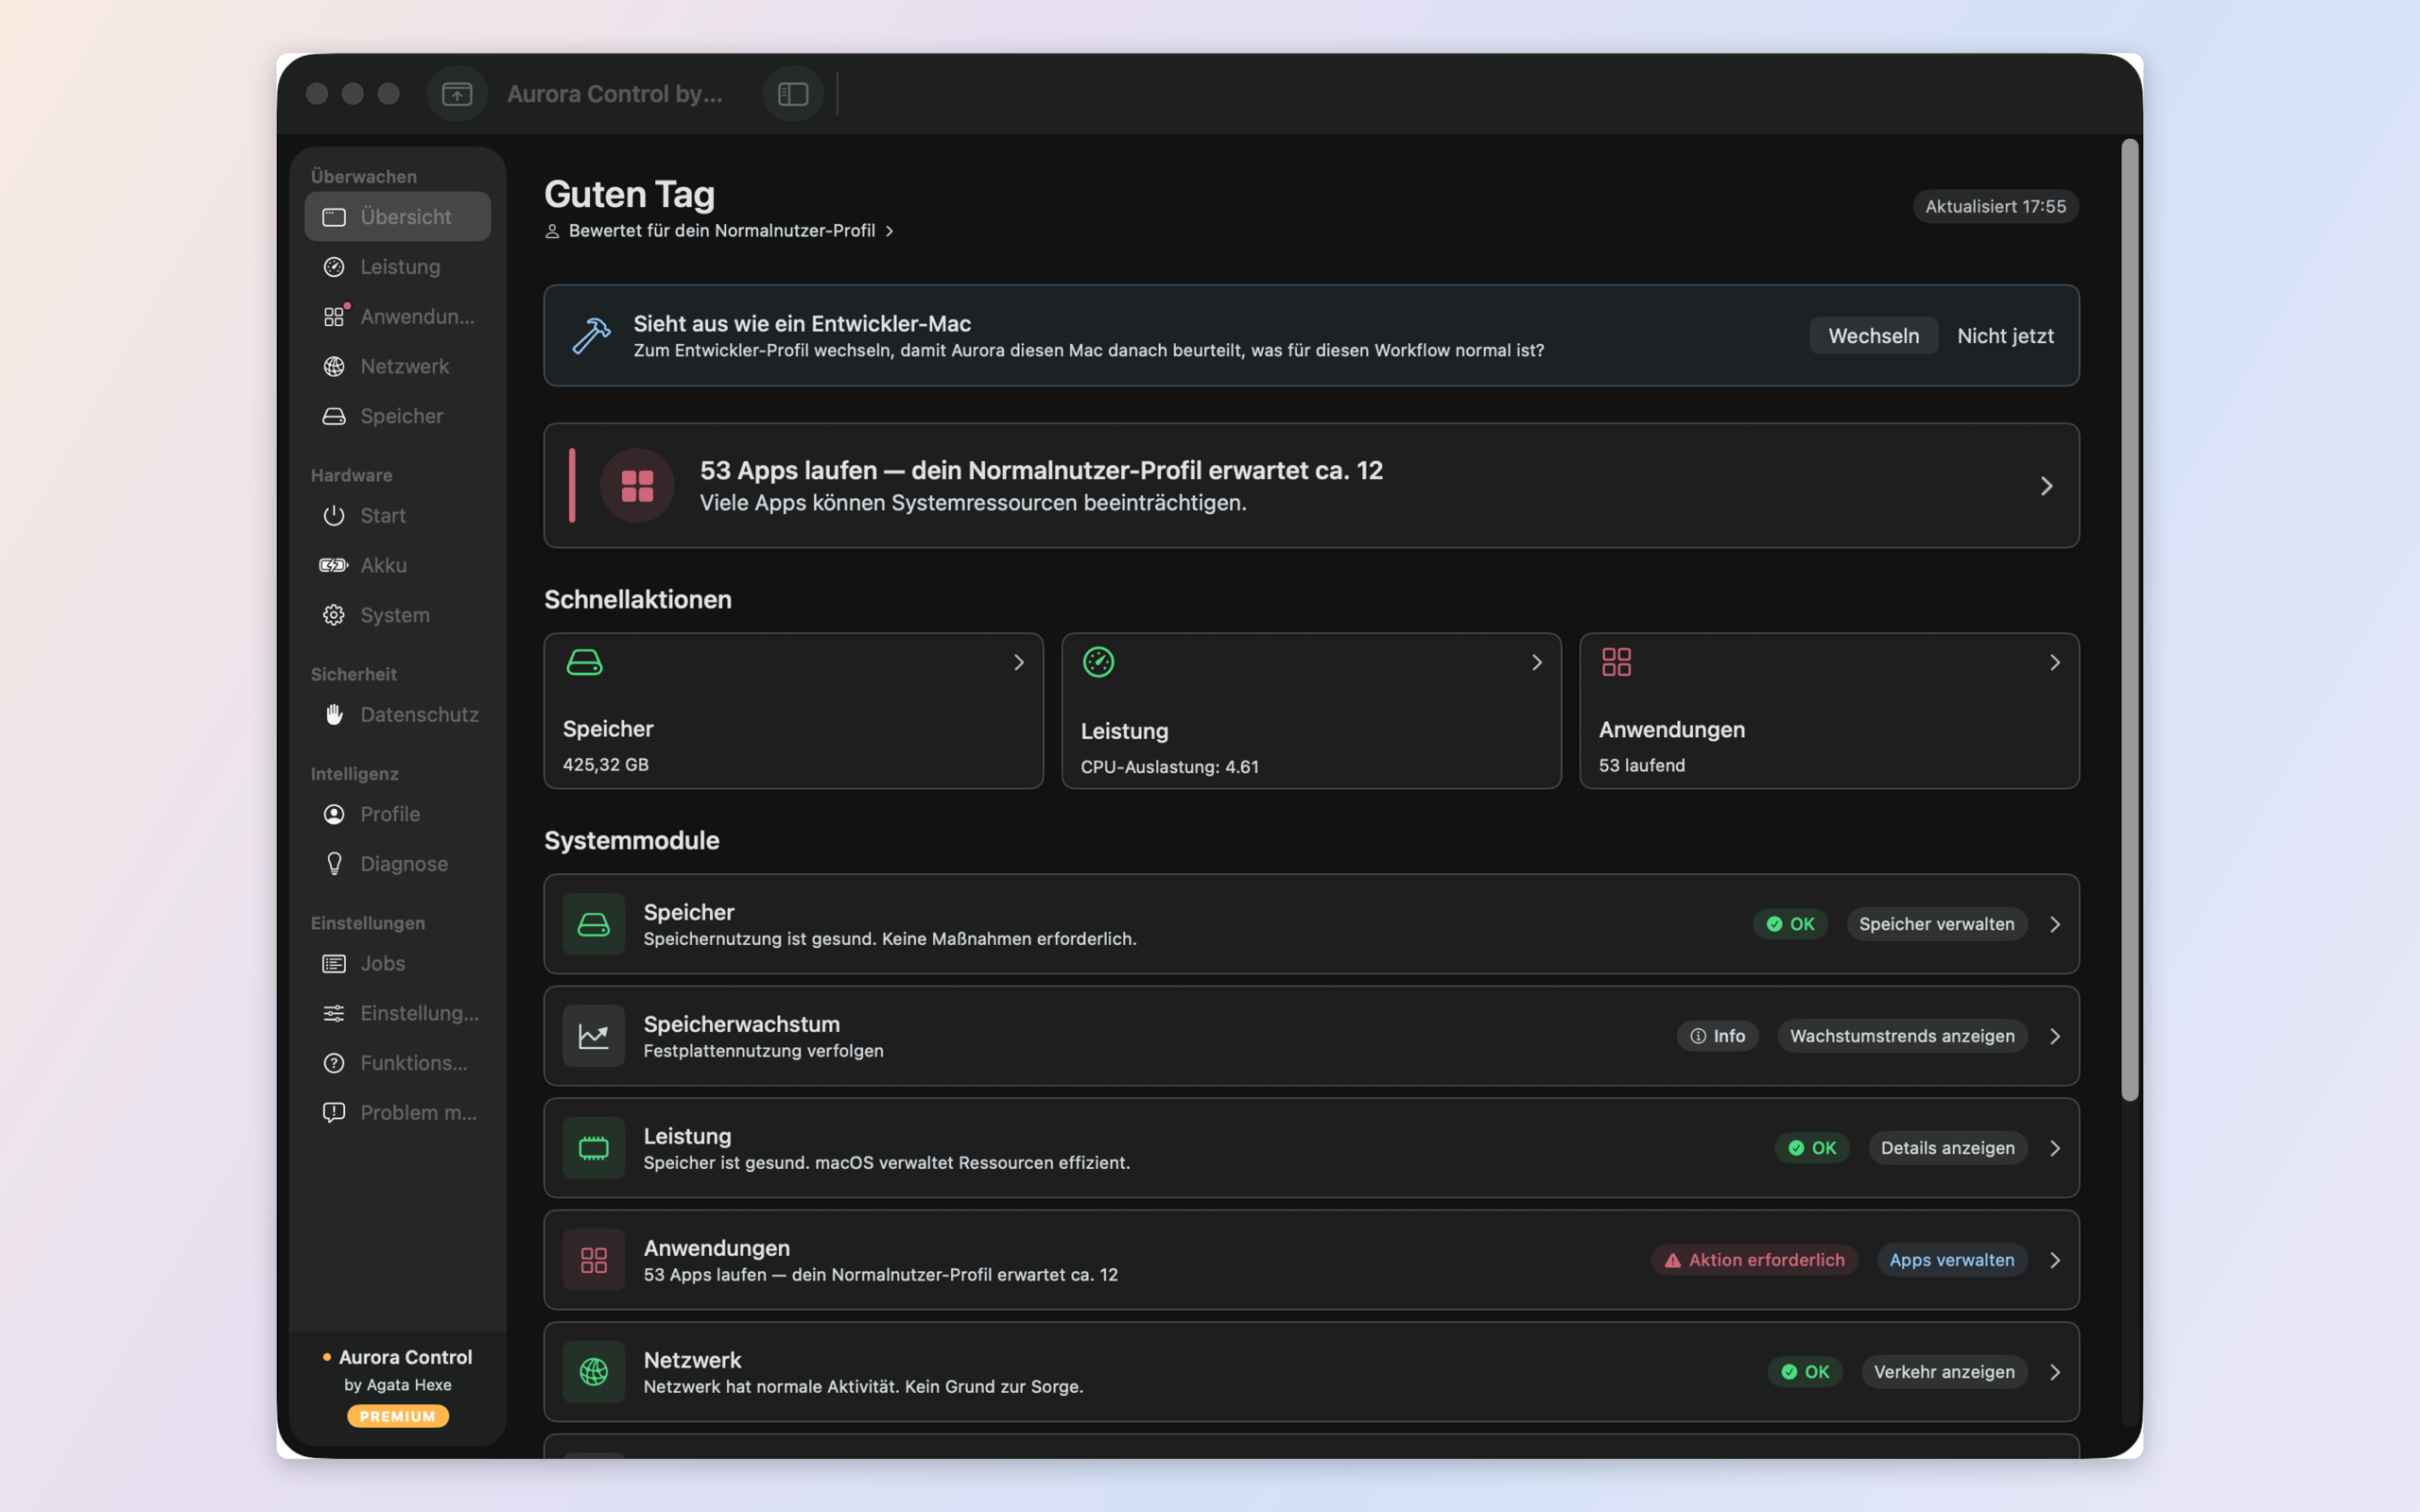
Dashboard
Every module at a glance — live verdicts tuned to your profile.
Storage
Storage is healthy. No action needed.
Performance
Memory is healthy. macOS is managing resources efficiently.
Applications
56 apps running — your General profile expects ~12.
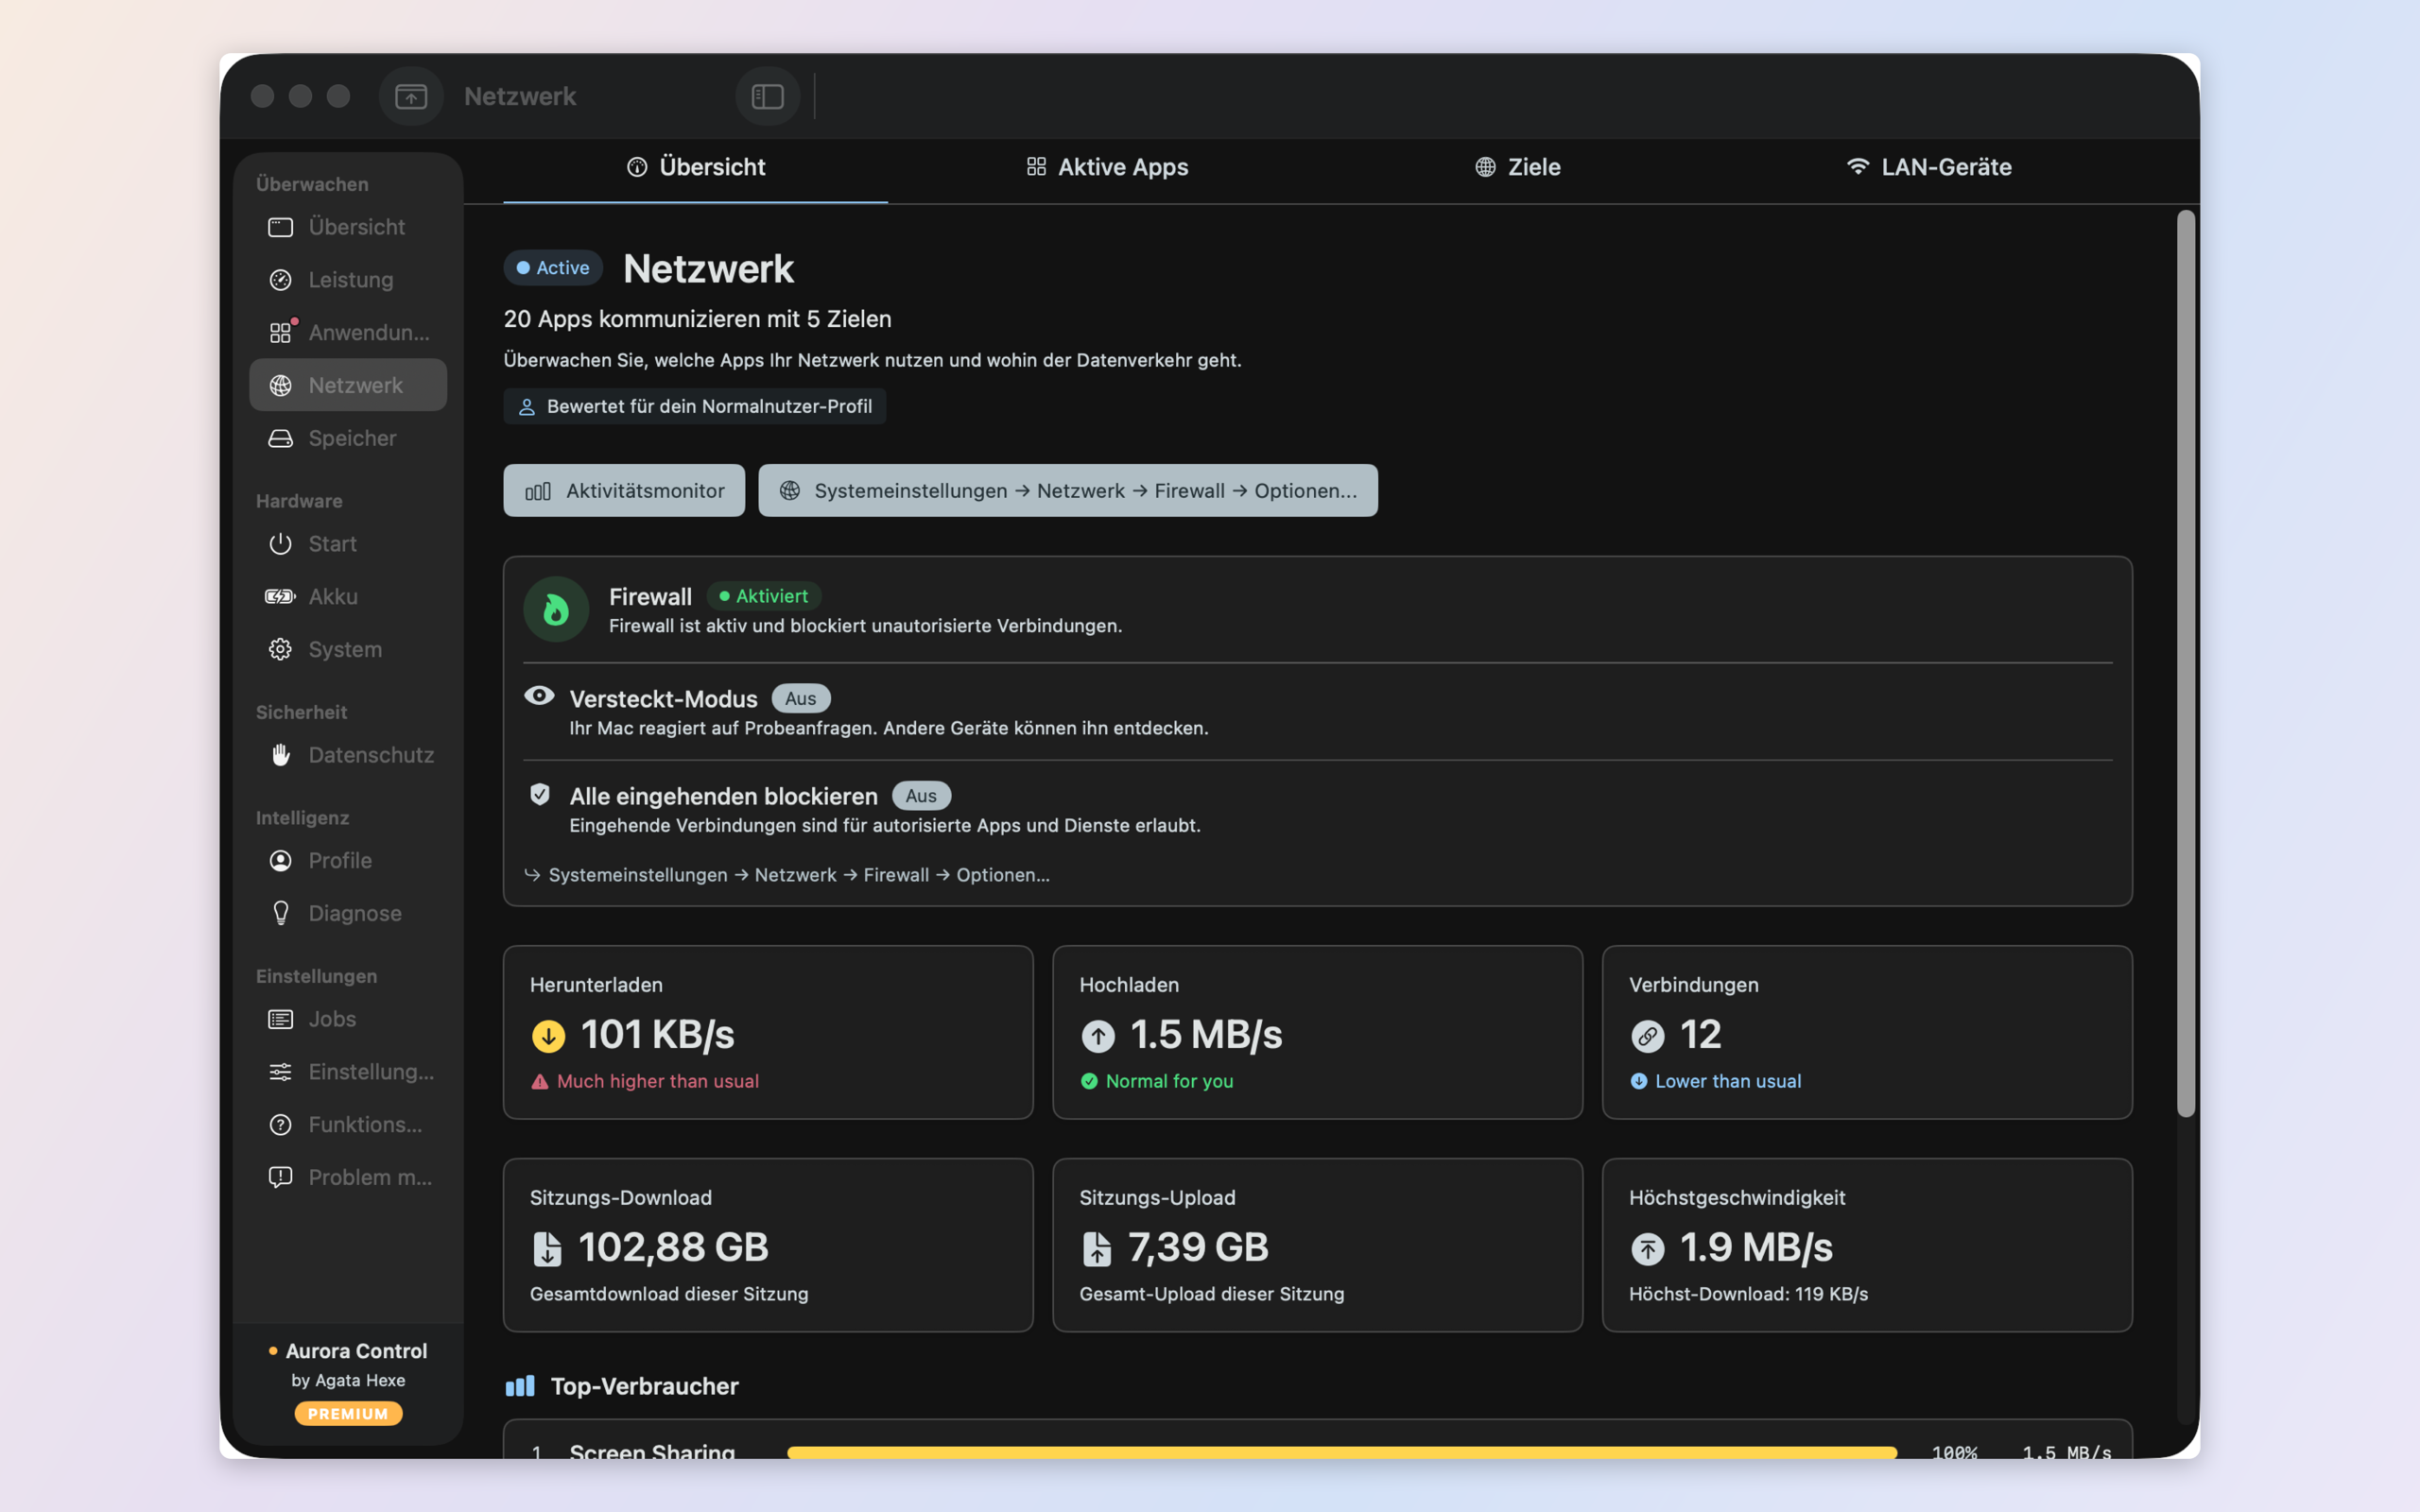
Network
20 apps communicating with 7 destinations.
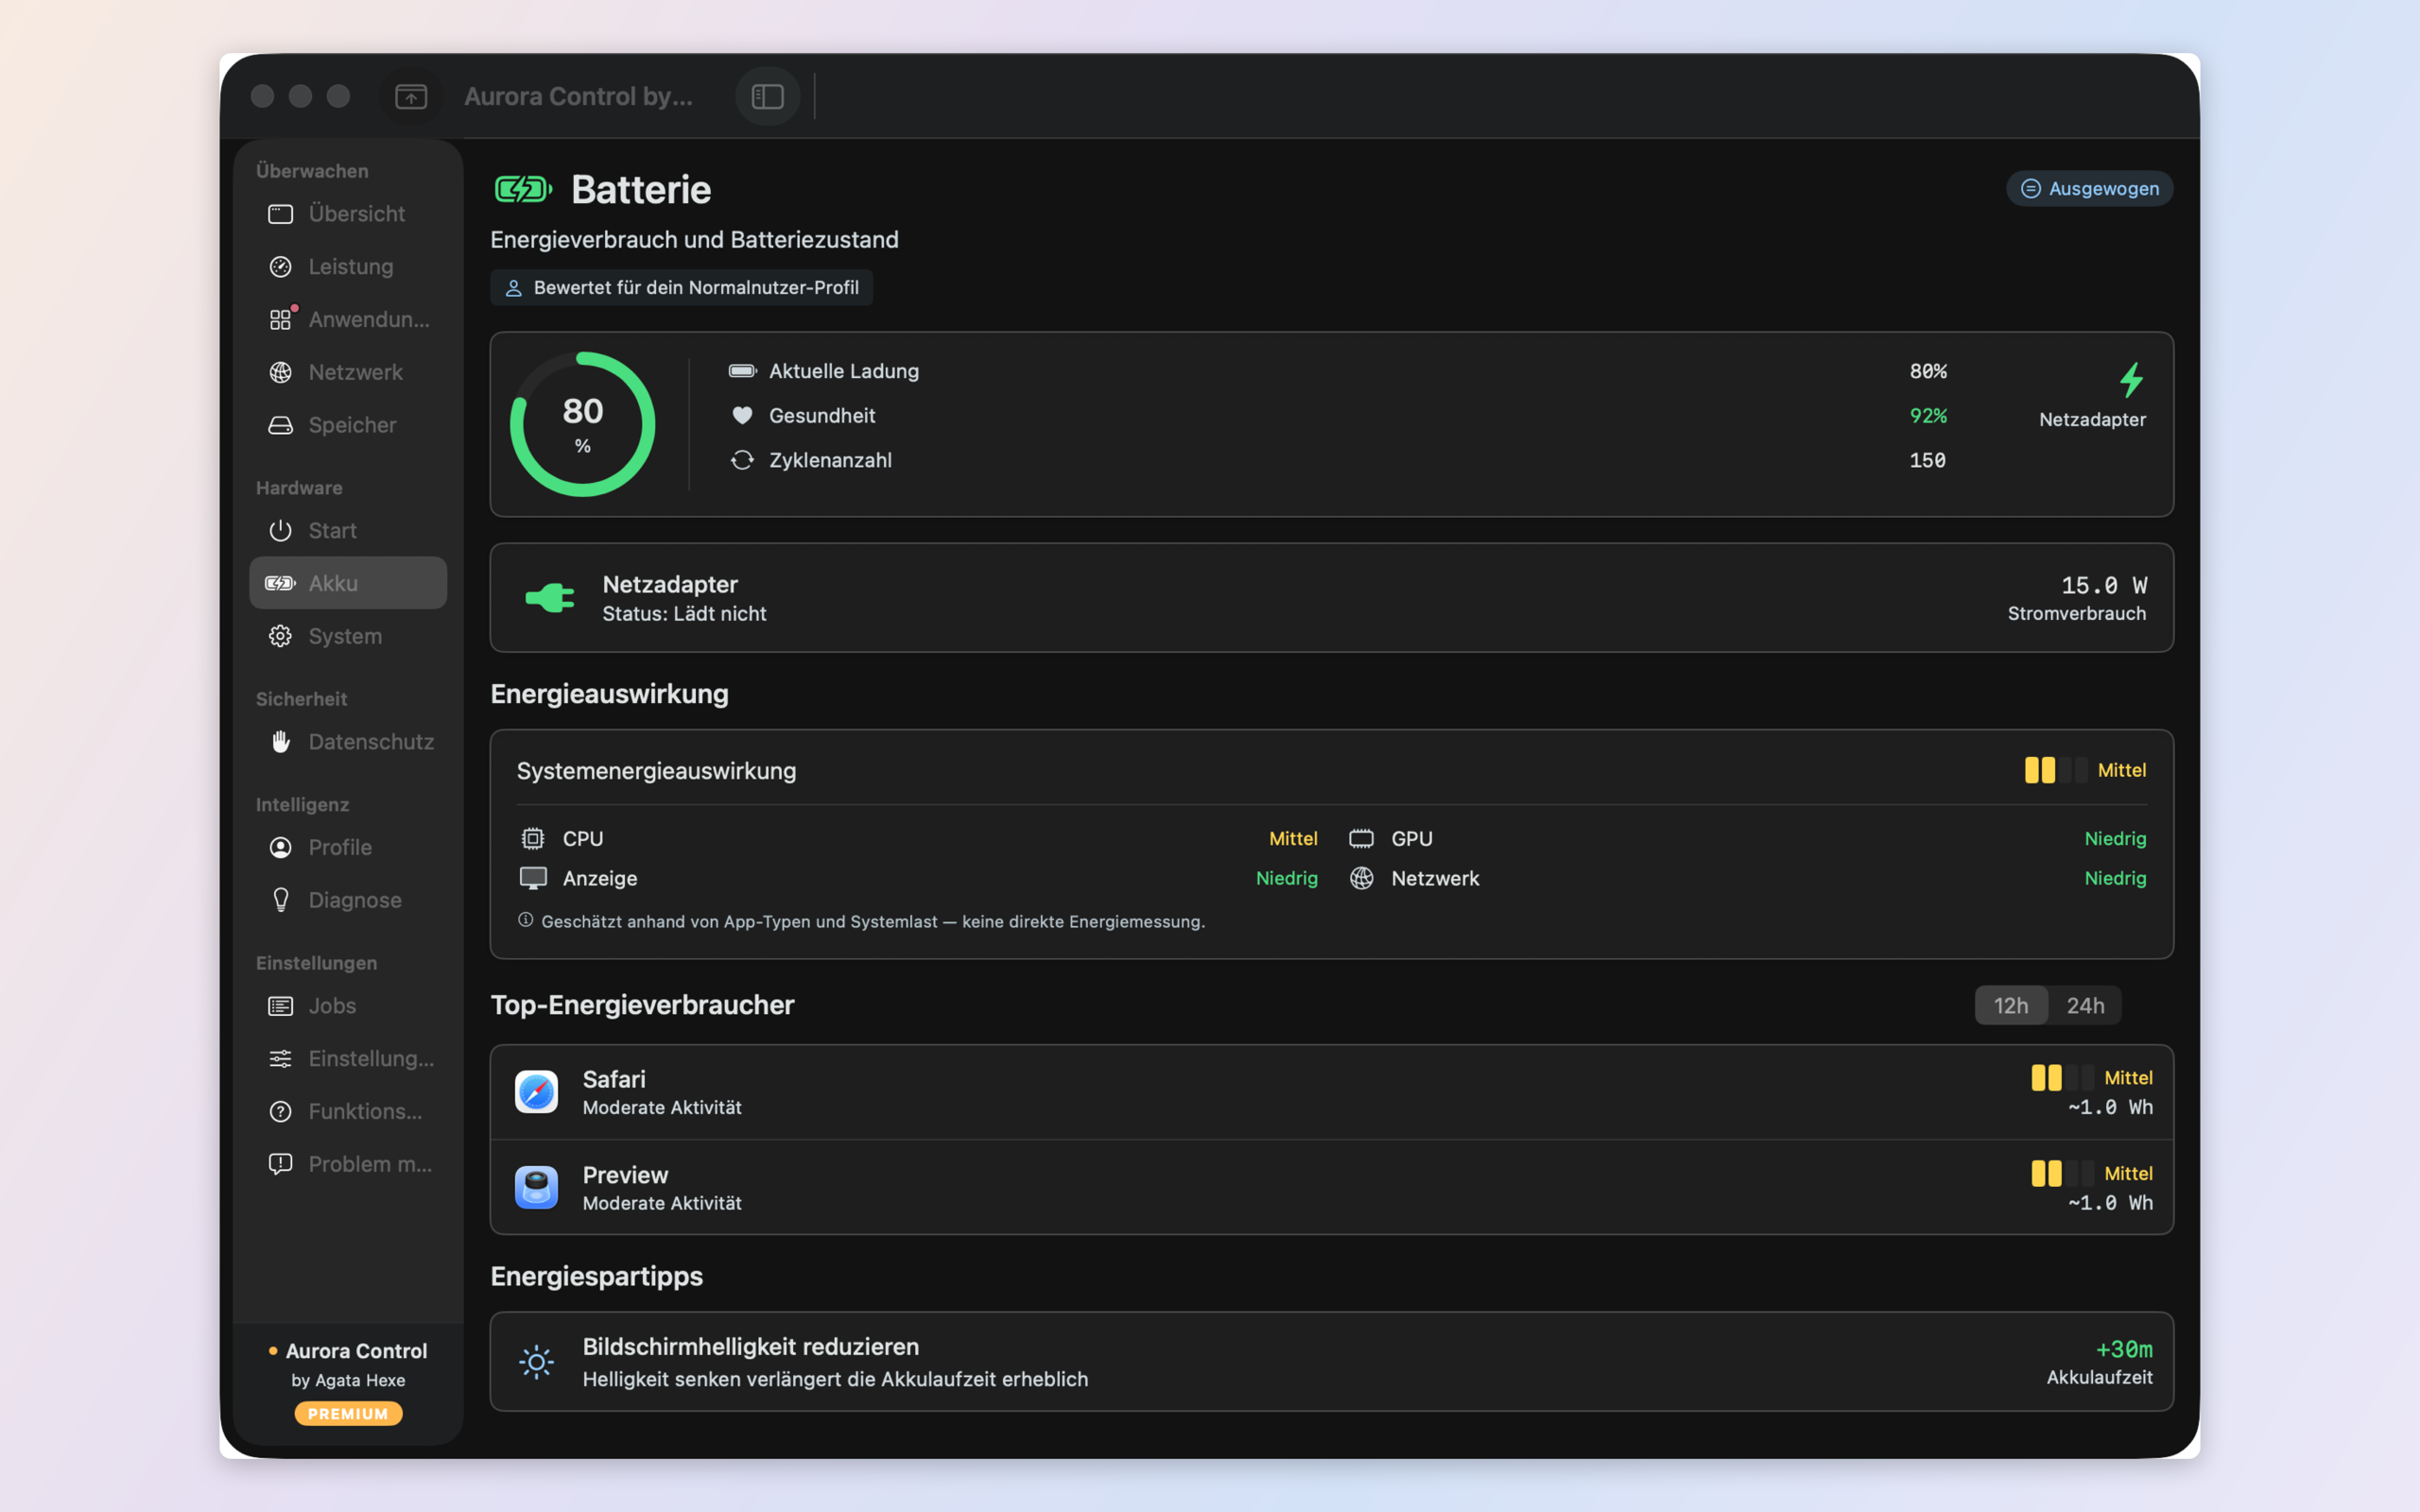
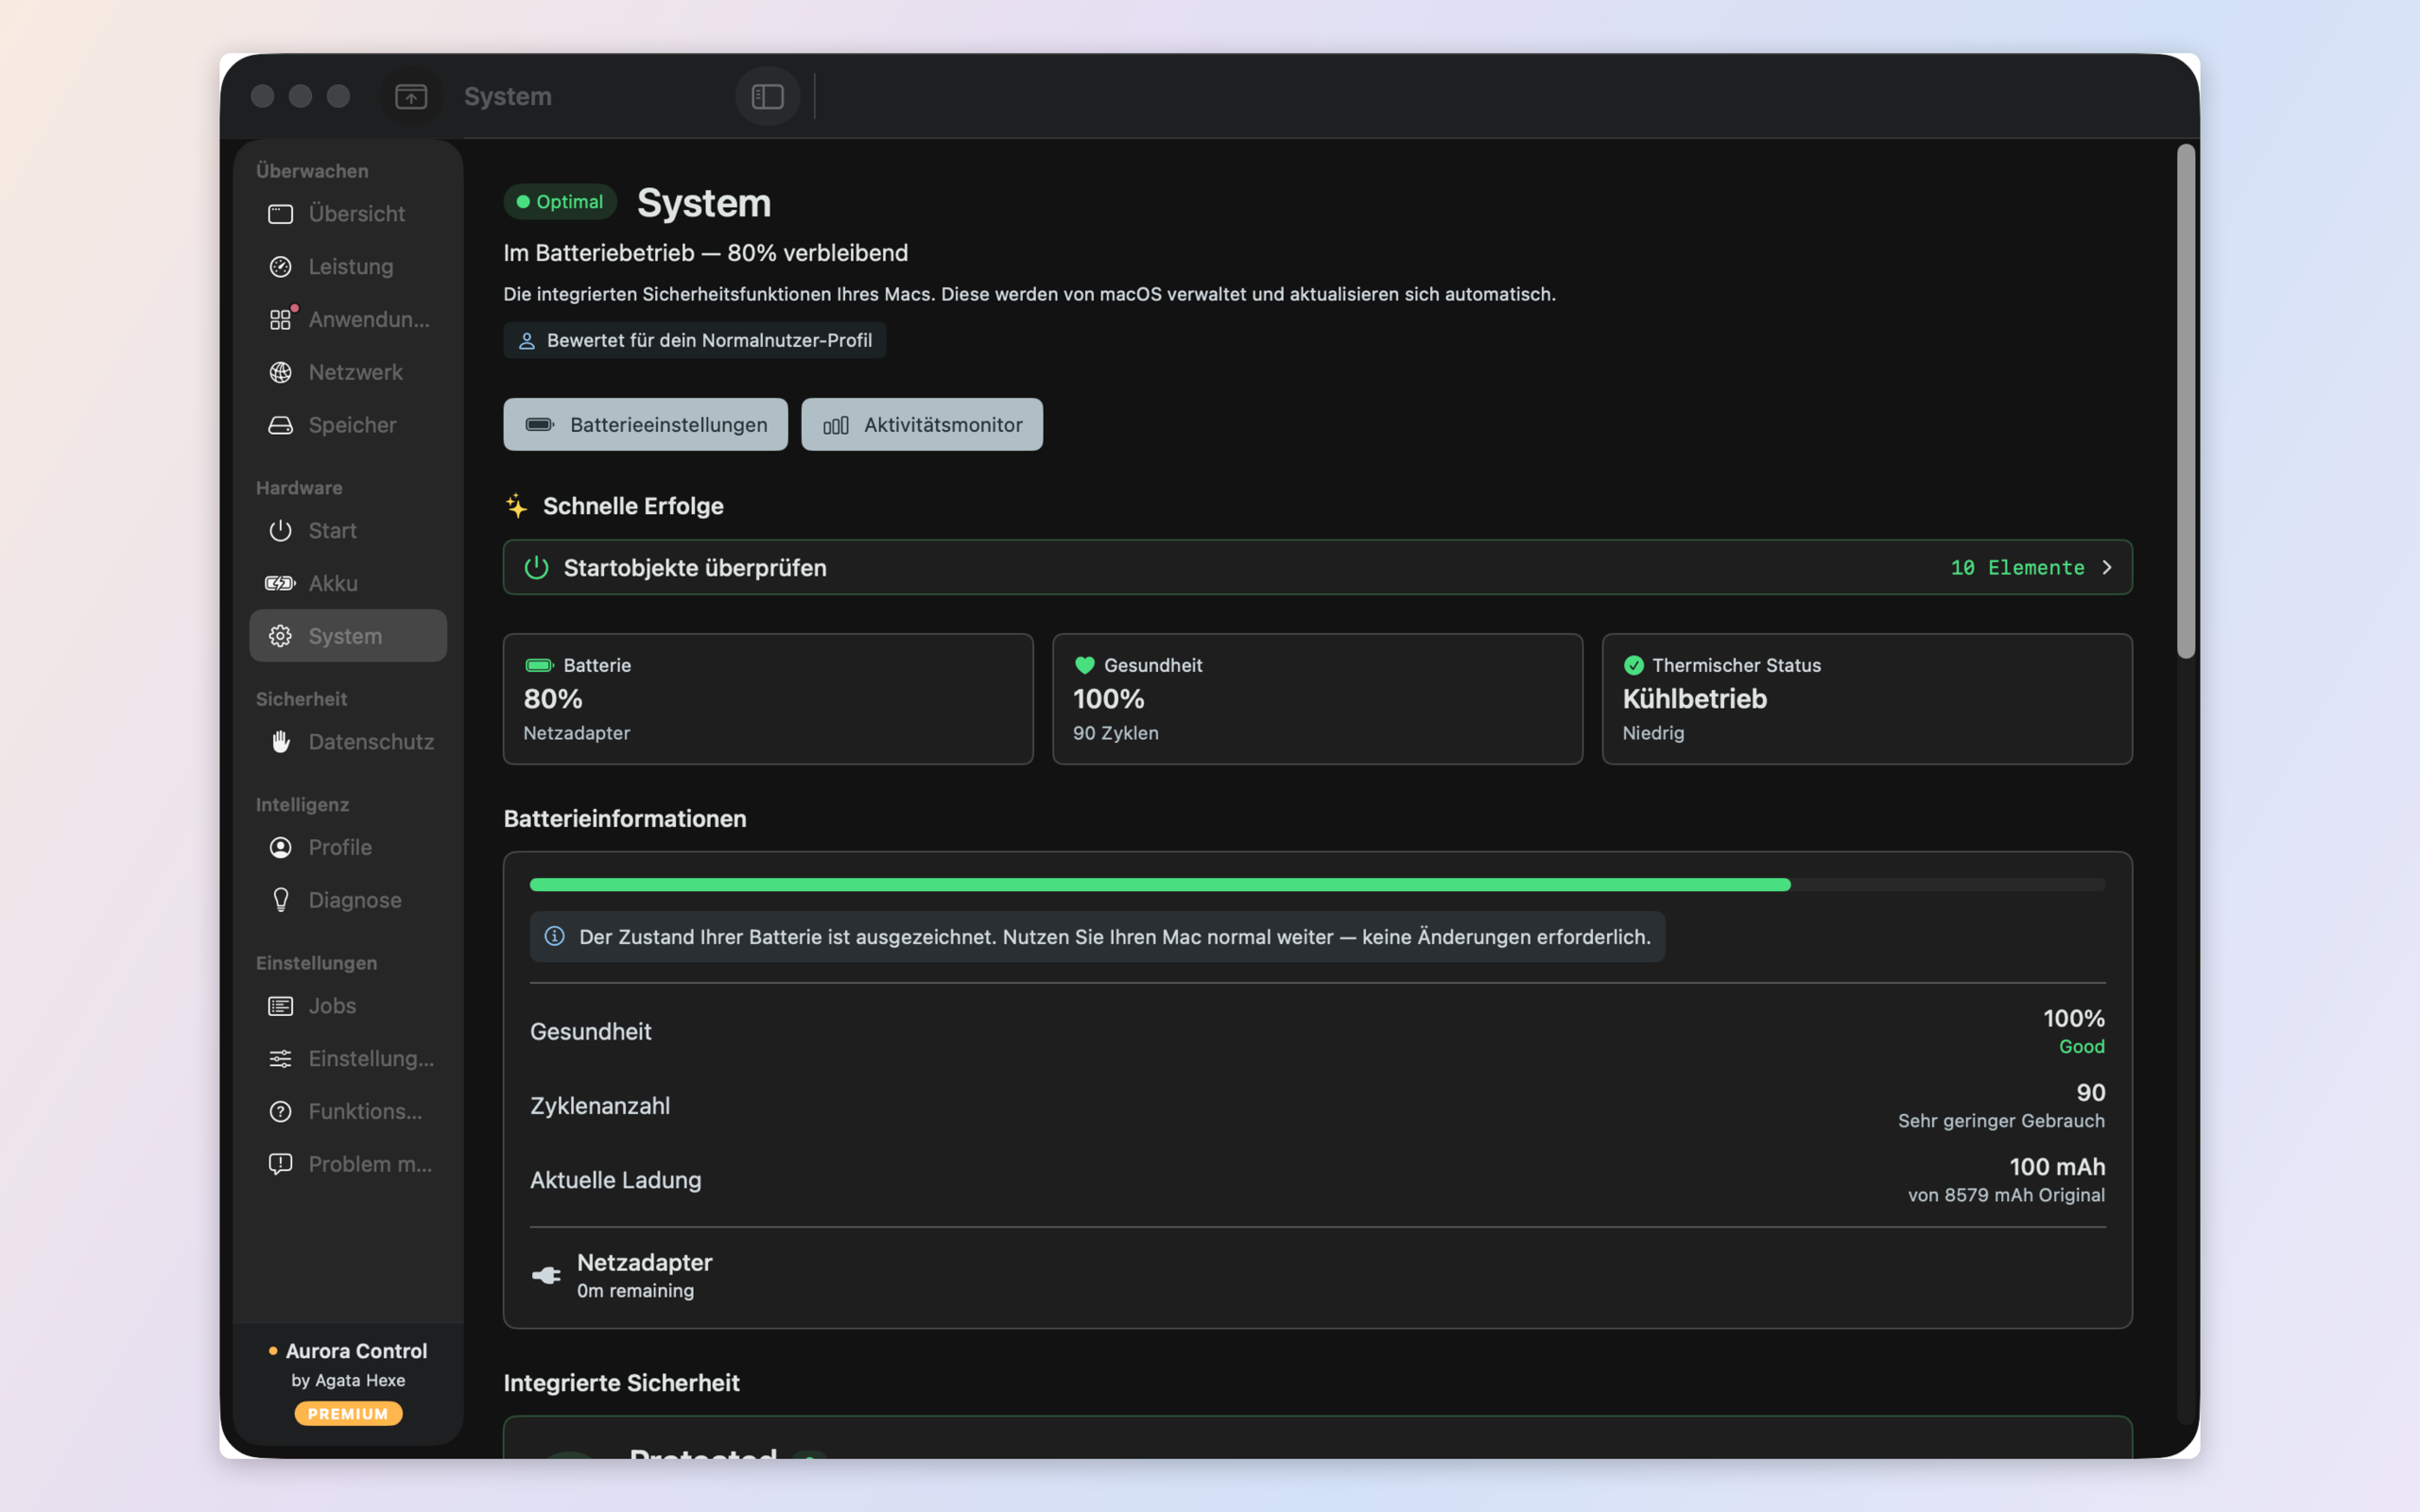
Battery & Thermal
Health 92% · temperatures normal.
See it in action
Private by design. Honest by default.
0
Bytes of telemetry sent
100%
Runs on your Mac
1×
Pay once — no renewals
Frequently Asked Questions
Your Mac deserves better than scare tactics and subscriptions
No subscription. No telemetry. No cloud. No account. Profile-aware diagnostics, causal insights, a real privacy audit, and safe one-tap actions — all 100% local.